Create business charts for
PowerPoint and Slides
Waterfall, Mekko, Gantt, scatter, and other charts for client decks and investor reports.
Trusted by






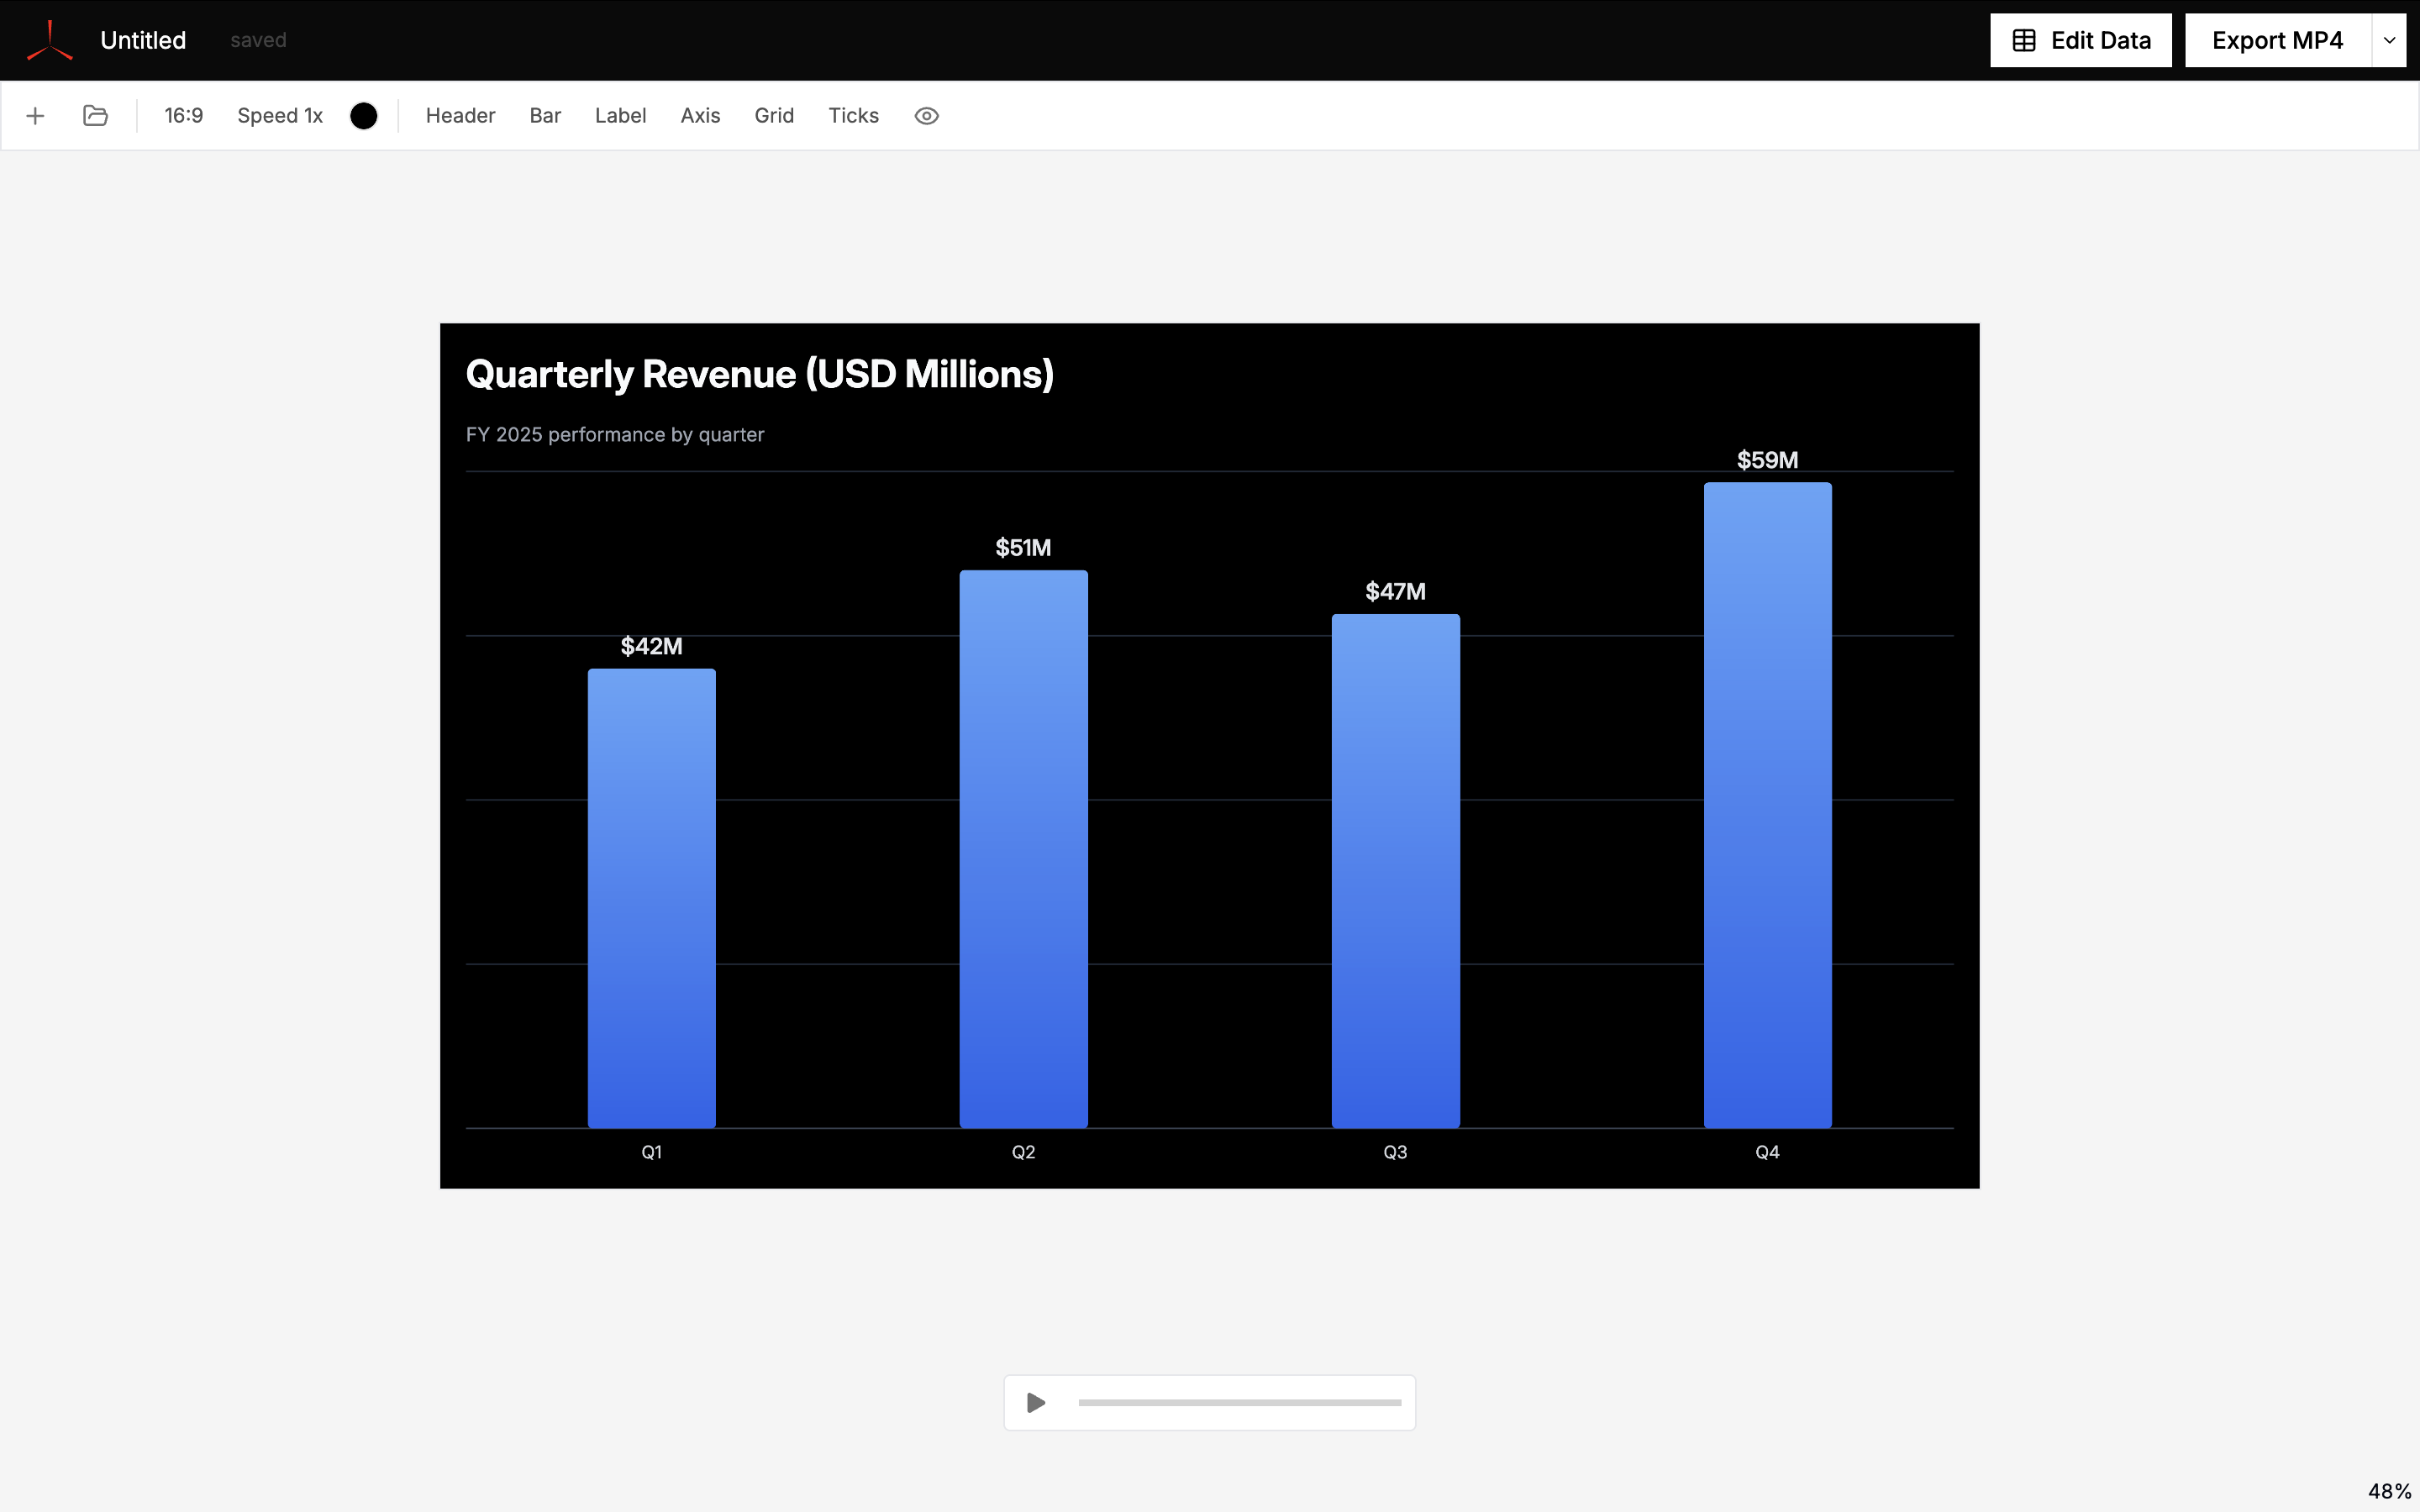
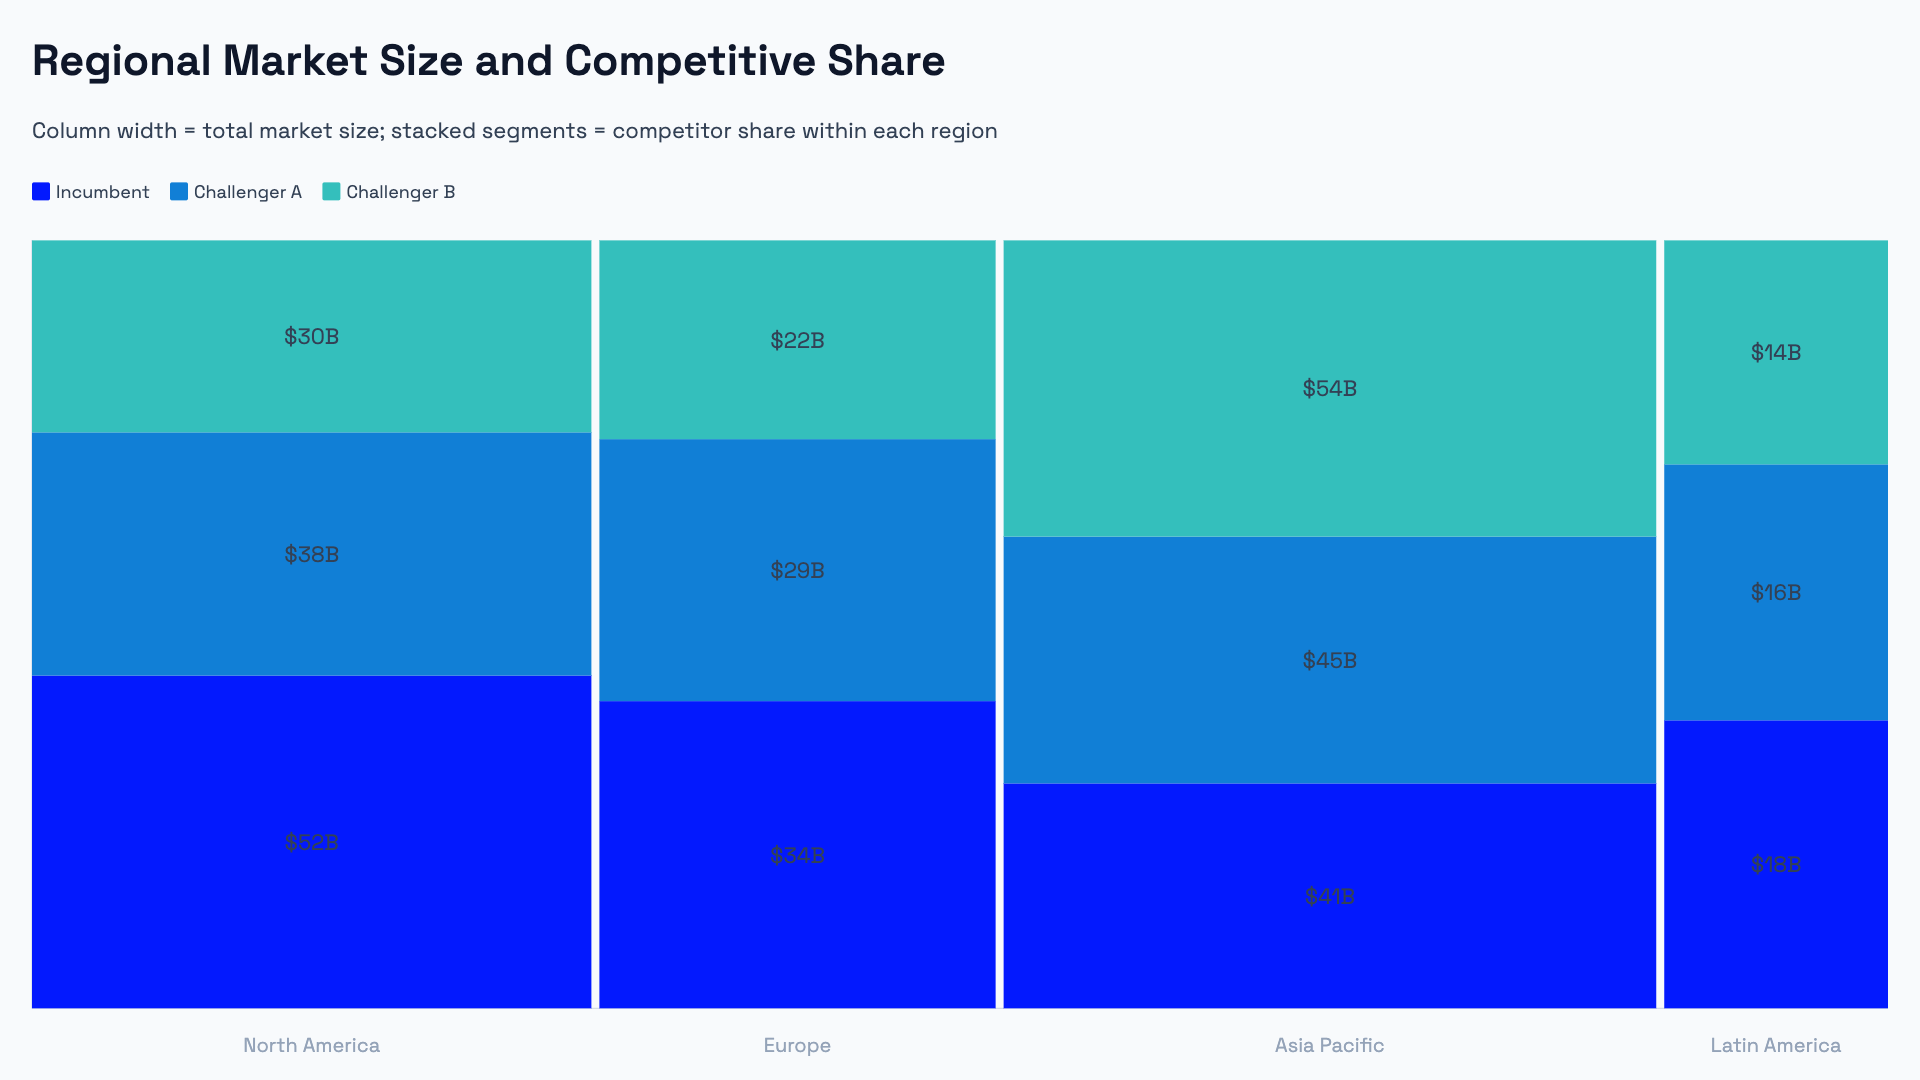
Advanced chart types for business decks.
Waterfall for EBITDA bridges and P&L walks, Mekko for market share by segment and size, stacked column for revenue mix over time, scatter and bubble for correlation analysis, pie and donut for budget allocation, and Gantt for project timelines and milestones.
Import data from anywhere.
Import an Excel or CSV file, connect a Google Sheets URL, or fetch data from any public URL.


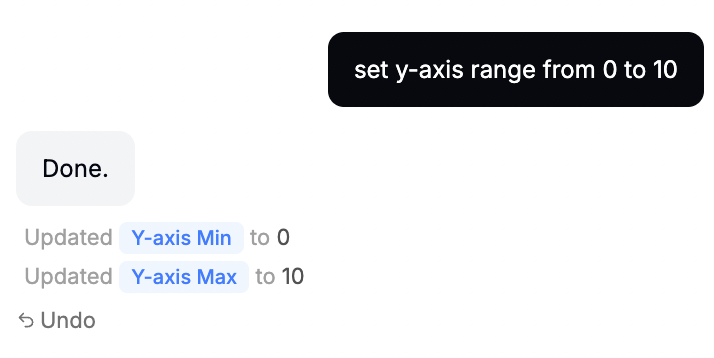
Customize charts with AI.
Chat with AI to style and edit a chart instead of learning the editor's interface. Manual editing through the interface is also available.
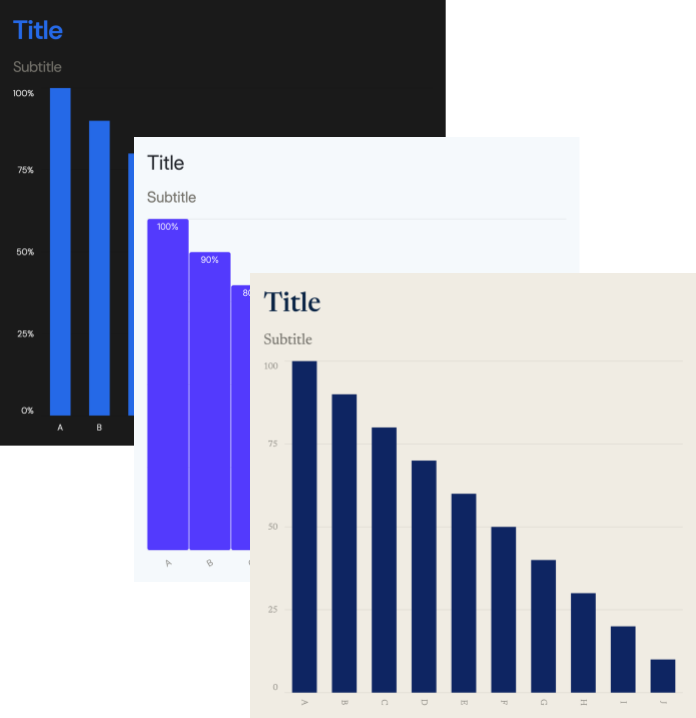
Custom styling and brand controls.
Fonts, colors, label formats, and axis ranges are editable. Team plans include a Brand Kit that applies saved settings across all charts.
Annotations that update with your data.
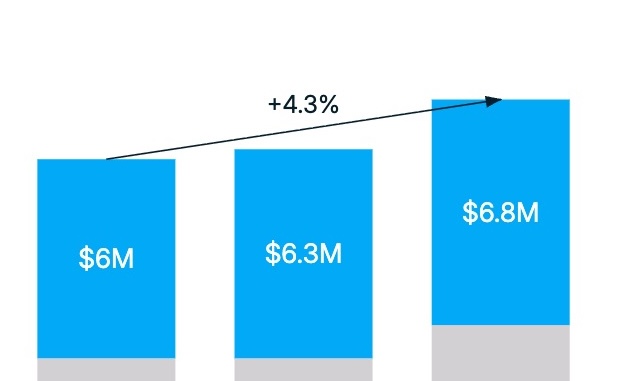
Add Value Lines, Diff Arrows, and CAGR Arrows directly on the chart. Diff and CAGR labels are computed from your data, so they update automatically when your numbers change, no manual redrawing.
Insert charts straight into your deck.
Use the AECharts add-on for PowerPoint or Google Slides to browse your saved charts and drop them into a slide, no exporting or re-uploading images required.
How to create charts with AECharts
Choose a business chart type — waterfall, Marimekko, Gantt, and more.
Add data or describe the chart — paste from Excel, Google Sheets, or CSV, or use an AI prompt to create a first draft.
Customize and download — edit labels, colors, fonts, and axes, then drop into PowerPoint or Google Slides.