Cycle Diagram Maker, Create Circular Process Charts Free
Built for sales cycles, product development loops, and any process that repeats rather than ends. Free to start.
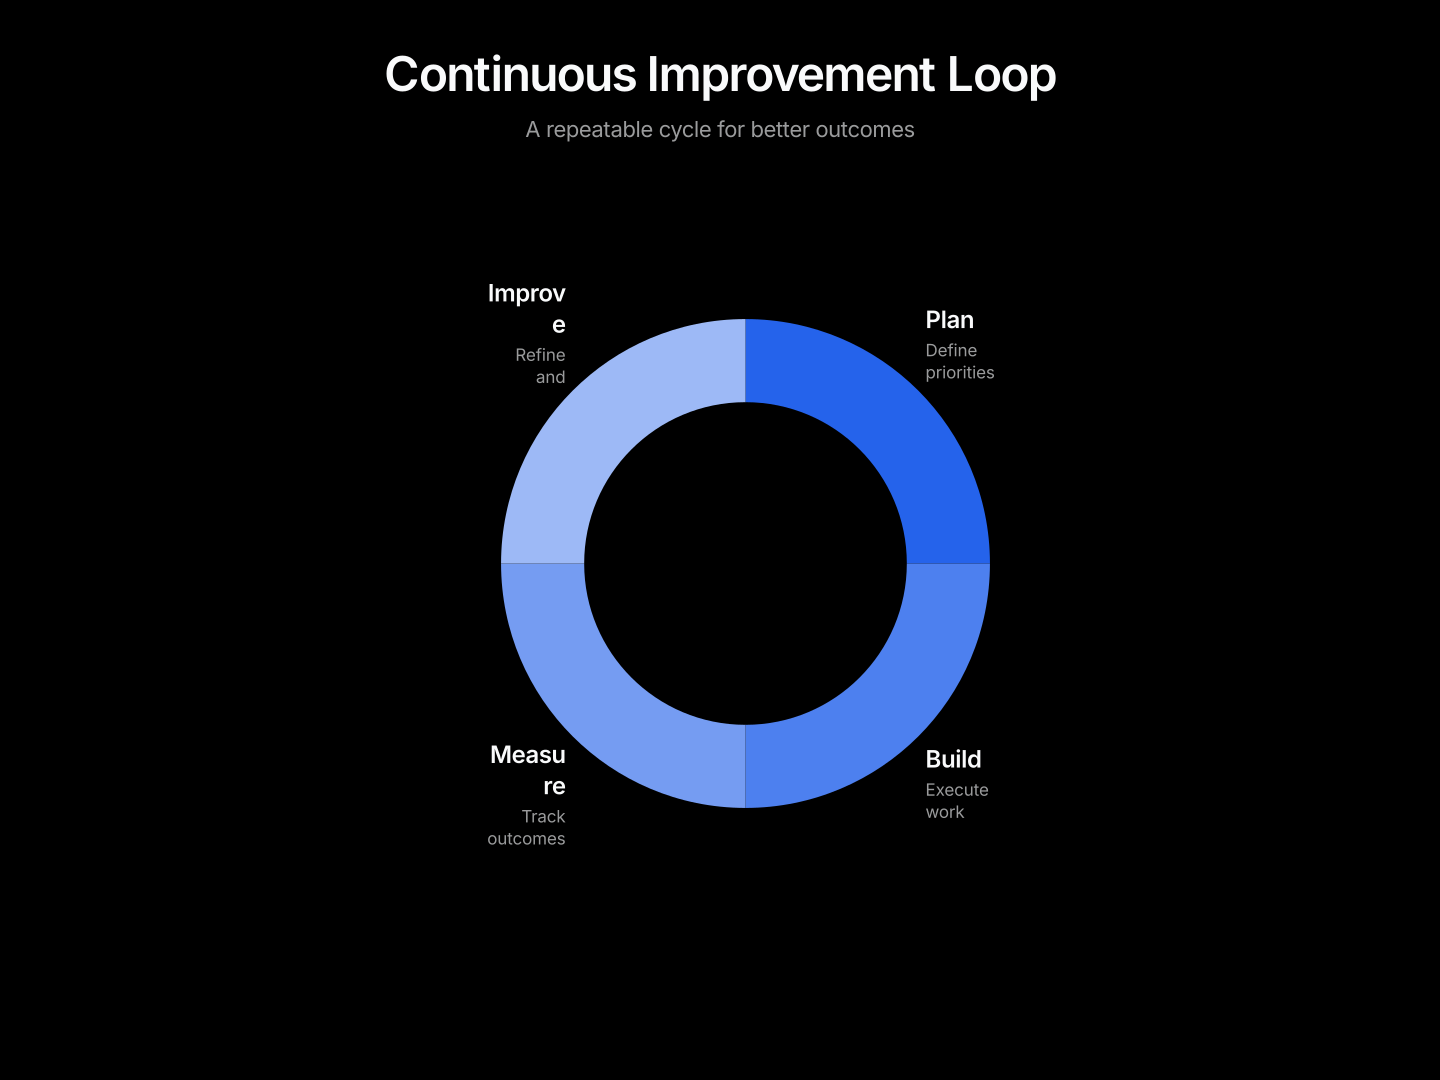
Everything You Need to Create Cycle Diagrams
- Easy Step Input: List your process steps in order. AECharts arranges them around the circle with connecting arrows automatically.
- 3–8 Step Layouts: Built for the range that reads clearly, enough steps to show real process detail without crowding.
- Export Straight to PowerPoint: Export and drop it directly into PowerPoint, Google Slides, or reports.
- Custom Colors: Each step gets its own color. Match your brand palette or use a built-in color scheme.
- Real-time Preview: See every change instantly. What you see in the editor is exactly what exports.
- No Design Skills Needed: Templates are professionally designed. Enter your steps and export. Most users are done in under a minute.
When to Use a Cycle Diagram
Cycle diagrams work best when your process loops back to the start rather than reaching a final endpoint.
- Sales Cycle: Show the recurring stages from prospecting through close and renewal.
- Product Development Loop: Show a build-measure-learn cycle or agile sprint process.
- Customer Feedback Loop: Show how feedback moves from collection through action and back to measurement.
- Operational Process: Show a recurring operations process like inventory replenishment or quality review.
- Strategic Planning Cycle: Show an annual or quarterly planning process that repeats each cycle.
- Talent Management Cycle: Show a recurring hiring, onboarding, review, and development process.
Cycle Diagram vs Process Flow Chart
Both show a sequence of steps, but they imply different endings.
Cycle Diagram
- Best for: Processes that repeat continuously.
- Strength: The circular layout communicates "this repeats" without extra text.
- Use when: Sales cycles, feedback loops, recurring operations.
Process Flow Chart
- Best for: A process with a clear start and finish.
- Strength: Linear layout makes sequence and completion obvious.
- Use when: Onboarding steps, project phases, approval workflows.
AECharts supports building both directly in the editor.
How to Create a Cycle Diagram
Choose a Template. Browse cycle diagram templates and pick one that fits your process.
Enter Your Steps. List each stage of your process in order. AECharts arranges them around the circle automatically.
Customize Colors & Style. Assign a color to each step and match your brand. Adjust fonts and background.
Export. Export and drop it directly into PowerPoint, Google Slides, or reports.
Frequently Asked Questions About Cycle Diagrams
Other chart makers
100% Stacked Bar Chart Maker100% Stacked Column Chart MakerArea Chart MakerBar Chart MakerBar Mekko Chart MakerBox Whisker Plot MakerBubble Chart MakerBullet Chart MakerBump Chart MakerCandlestick Chart MakerChord Diagram MakerCircle Packing Chart MakerConcentric Circle Chart MakerDumbbell Chart MakerFishbone Diagram MakerFunnel Chart MakerGantt Chart MakerGauge Chart MakerGrouped Bar Chart MakerHalf Donut Chart MakerHeatmap MakerHistogram MakerHorizontal Bar Chart MakerLine Chart MakerMekko Chart Maker (Marimekko)Nightingale Rose Chart MakerPareto Chart MakerPictograph MakerPie Chart MakerPopulation Pyramid MakerPyramid Chart MakerRadar Chart MakerRadial Bar Chart MakerRidgeline Chart MakerSankey Chart MakerScatter Plot MakerSegmented Bar Chart MakerSemicircle Pie Chart MakerSlope Chart MakerStacked Area Chart MakerStacked Column Chart MakerStacked Waterfall Chart MakerStep Chart MakerStream Graph MakerSunburst Chart MakerTornado Chart MakerTreemap Chart MakerTrellis Chart MakerVenn Diagram MakerWaffle Chart MakerWaterfall Chart Maker