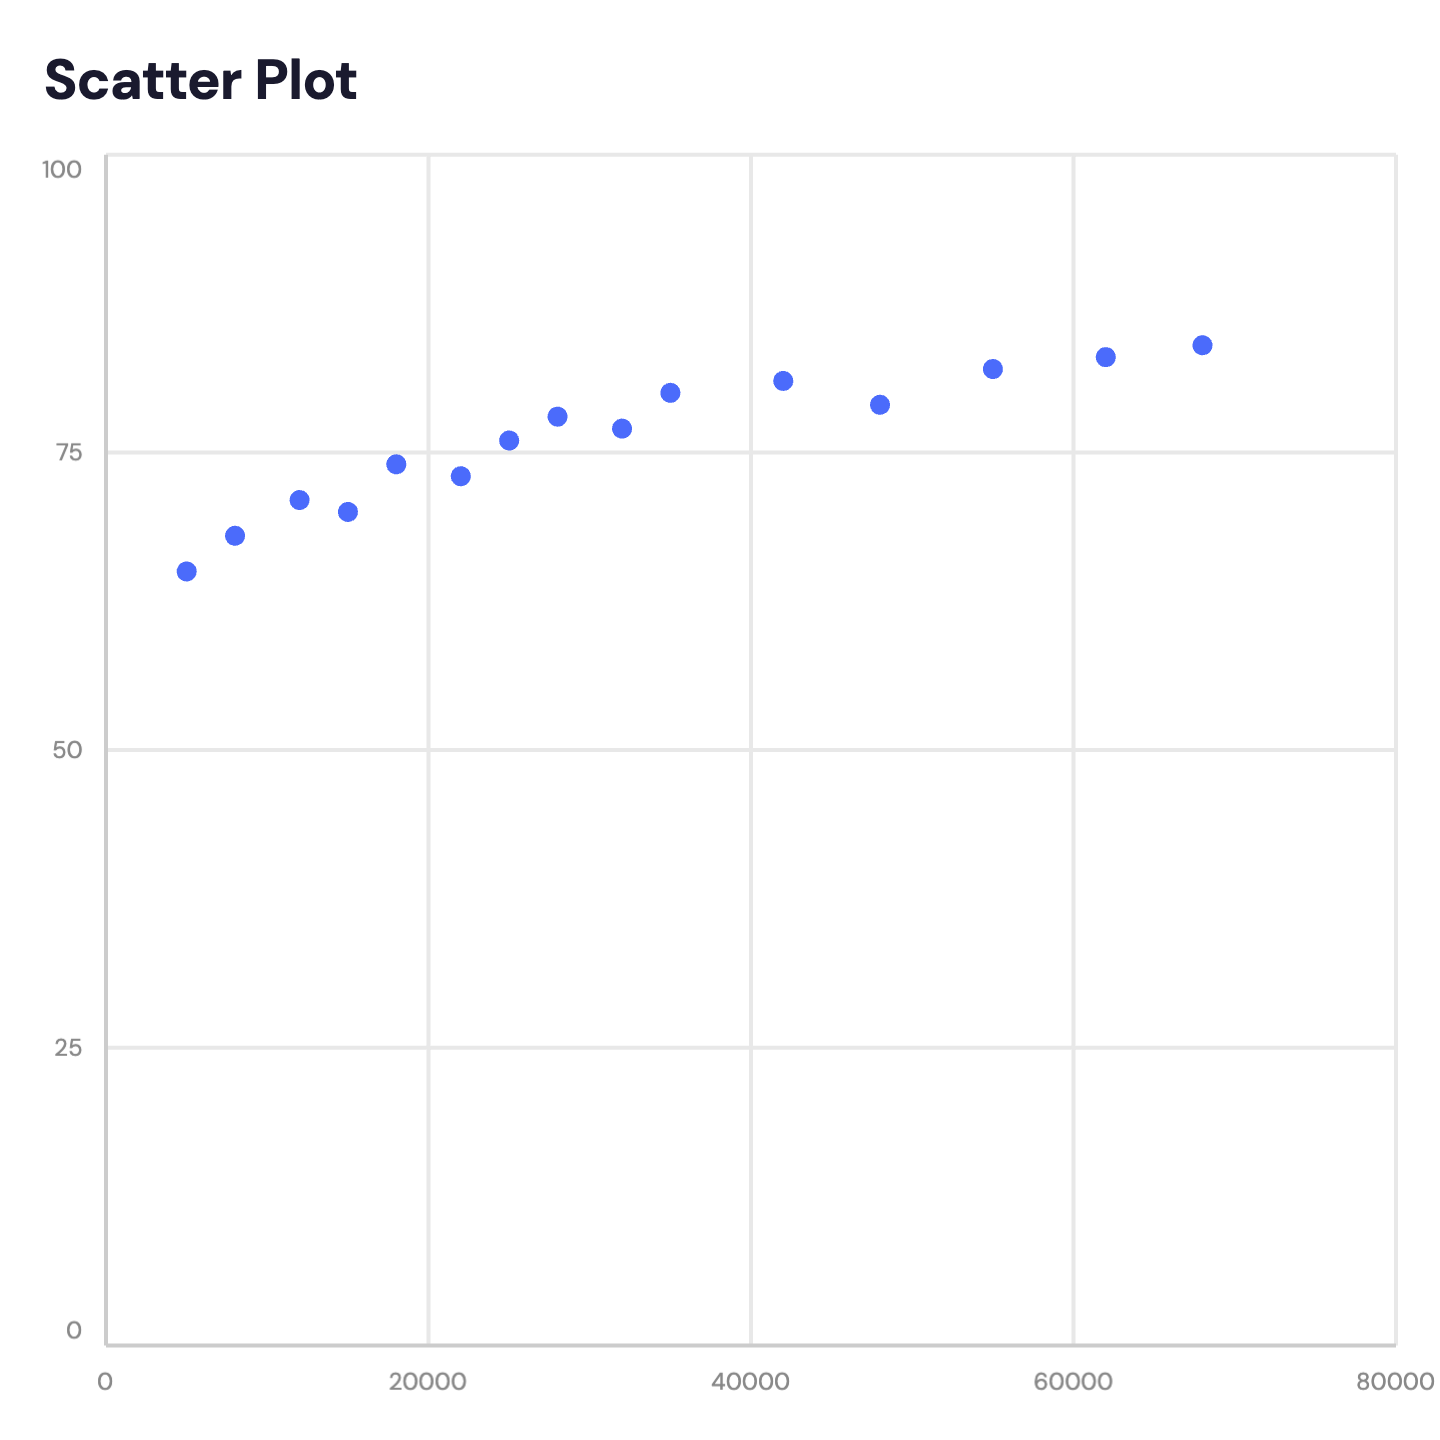
Scatter Plot Maker — Create Scatter Plots Online for Free
Built for correlations, distributions, and any time you need to show a relationship between two variables. Free to start.
When to Use a Scatter Plot
Scatter plots are the right tool when you want to show a relationship — or the absence of one — between two numeric variables.
Correlation Analysis
Revenue vs. headcount, ad spend vs. conversions, price vs. demand. Scatter plots make correlations visible at a glance.
Customer Segmentation
Plot customers by spend vs. frequency to identify high-value segments, at-risk accounts, or clusters worth targeting.
Research Findings
Show the distribution of data points across two measured variables. Scatter plots are standard in academic and research presentations.
Competitive Benchmarking
Plot companies by market share vs. growth rate. Instantly see who is growing fast, who is large but slow, and who is both.
Sales Performance
Rep activity (calls made) vs. output (deals closed). Identify top performers and outliers without a wall of numbers.
Outlier Detection
Unusual data points stand out immediately. Scatter plots surface anomalies that tables and averages hide.
Scatter Plot vs Line Chart
Both use X and Y axes — but they answer different questions.
Scatter Plot
Best for: Showing relationships between two independent numeric variables.
Strength: Reveals correlation, clustering, and outliers that aggregated data hides.
Use when: Both axes are measurements — revenue vs. headcount, spend vs. ROI.
Line Chart
Best for: Showing change over time for one or more metrics.
Strength: The connected line emphasizes trend — rising, falling, or stable.
Use when: The X axis is time — months, quarters, or years.
AECharts supports both. Switch between scatter and line to find the right format for your data.
How to Create a Scatter Plot
Choose a template
Browse scatter plot templates and pick one that matches your style.
Paste your data
Copy from Excel or Google Sheets. Two numeric columns (X and Y) — AECharts plots the points automatically.
Customize colors and style
Adjust dot colors, axis labels, and background to match your brand.
Export as video or image
Export as a 1080p MP4 or static image. Drop into slides, reports, or share directly.
Frequently Asked Questions
Create Your Scatter Plot Today
Paste your data, pick a template, and export in under a minute. Free to start — no credit card required.