Free Waterfall Chart Templates
Browse waterfall and stacked waterfall chart templates for P&L bridges, budget walks, and cumulative contribution analysis. Easier than the Excel workaround, drop the finished chart into PowerPoint or Google Slides.
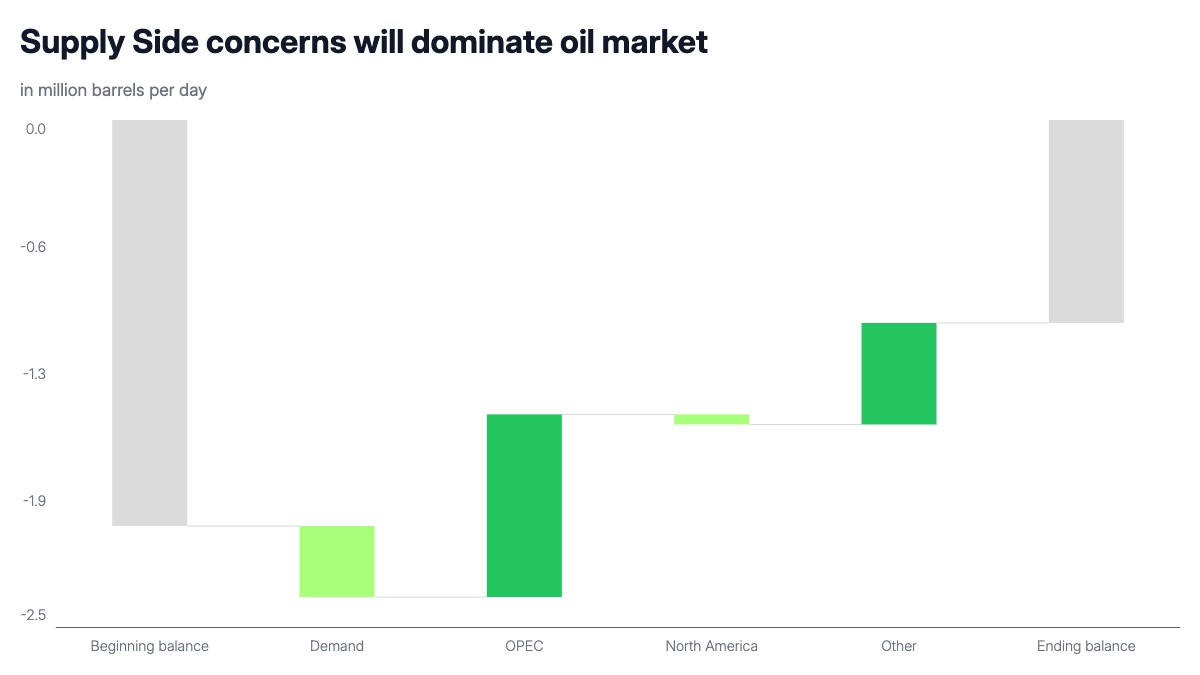
Waterfall chart templates for financial presentations
Waterfall charts, also called bridge charts, show how a starting value grows or shrinks across contributors. They're the standard format for P&L analysis, budget bridges, and variance explanations. When a single step is driven by more than one factor, a stacked waterfall breaks that step into its component parts instead of a single bar. Building either one in Excel requires a workaround. In AECharts, pick a template and paste your numbers.
What is a waterfall chart template?
A waterfall chart template is a pre-built chart layout for showing how a starting value increases and decreases across a series of contributors to reach a final total. AECharts waterfall chart templates come ready to fill with your own data, no formulas or manual formatting required. Common uses include P&L bridges, cash flow statements, revenue bridges, and budget variance analysis.
What is a stacked waterfall chart?
A stacked waterfall chart is a waterfall where one or more steps are broken into segments, showing which categories drove that step's change instead of a single value. Use it when a revenue or cost change at a given step is the result of multiple products, regions, or line items rather than one factor.
What types of waterfall chart templates are available?
AECharts includes waterfall chart templates for P&L bridges (revenue to net income), budget variance (budget vs actual by department), cash flow analysis (operating, investing, and financing activities), and revenue bridges (showing what drove growth or decline between periods), plus stacked waterfall templates for steps with multiple contributors. All templates support positive and negative values with separate color coding.
What is a waterfall chart used for?
Waterfall charts are most commonly used in finance and business presentations to show how a starting value changes through a series of additions and subtractions, for example how operating income bridges to net income, or how a budget compares to actuals across departments.
Can I use these waterfall chart templates in PowerPoint and Google Slides?
Yes. Waterfall charts drop directly into both PowerPoint and Google Slides. You can also save a static image to embed in any document or report.
Is it easier than building a waterfall chart in Excel?
Yes. Excel doesn't have a native bridge-style waterfall chart, you have to build one from a stacked bar chart using invisible base segments. AECharts has purpose-built waterfall templates you fill with your own data.
Are the waterfall chart templates free?
Yes. Waterfall chart templates are free to use, customize, and export. Exports include a watermark on the free plan; upgrading to Pro removes it.
Browse individual templates