Funnel Chart Maker, Create Funnel Charts Online for Free
Built for sales pipelines, marketing funnels, hiring processes, and any time you need to show drop-off across stages. Free to start.
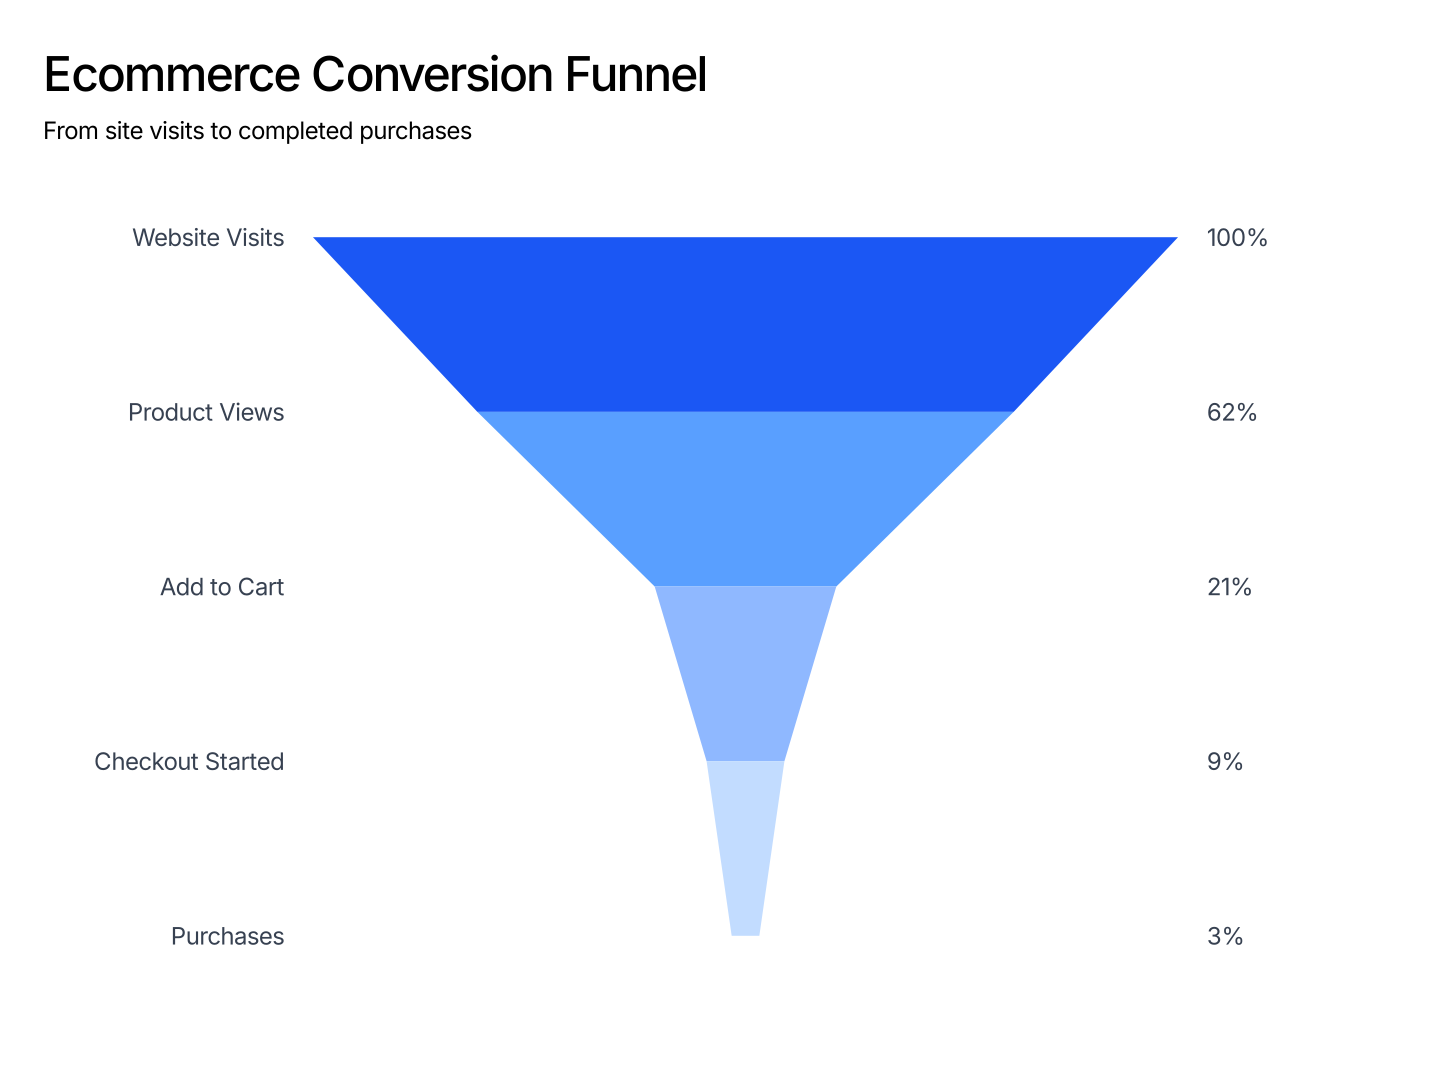
Everything You Need to Create Funnel Charts
- Easy Data Input: Paste from Excel or Google Sheets. One row per stage. AECharts maps each row to a bar and orders them automatically.
- Custom Colors per Stage: Assign a distinct color to each stage. Use a gradient to show progression or highlight a specific drop-off point.
- Export Straight to PowerPoint: Export and drop it directly into PowerPoint, Google Slides, or reports.
- Labels & Values: Show absolute values, percentages, or conversion rates next to each bar. Control position and formatting from the editor.
- Real-time Preview: See every change instantly. What you see in the editor is exactly what exports.
- No Design Skills Needed: Templates are professionally designed. Paste your data, adjust colors, and export. Most users are done in under a minute.
When to Use a Funnel Chart
Funnel charts work best when you have a sequential process where volume decreases at each step.
- Sales Pipeline: Leads to Qualified to Proposal to Negotiation to Closed. Each stage's bar shows how many deals remain. Stakeholders see conversion at a glance.
- Marketing Funnel: Impressions to Clicks to Sign-ups to Activated to Retained. A funnel chart makes the biggest drop-off obvious without reading every number.
- Hiring Process: Applications to Phone screens to Onsite to Offers to Accepted. Track where candidates drop out and benchmark across roles or quarters.
- E-commerce Checkout: Cart to Checkout started to Payment entered to Order placed. Show where customers abandon and quantify the revenue impact.
- Onboarding Flow: Sign-up to Profile set up to First action to Day-7 active. Funnel charts expose which onboarding step is losing the most users.
- Investor Update: Show pipeline health or user acquisition funnel in a board deck. A single funnel visual communicates more than a table of stage counts.
Funnel Chart vs Bar Chart
Both use bars to represent values, but they serve different purposes.
Funnel Chart
- Best for: Sequential stages where values decrease, pipelines, funnels, conversion flows.
- Strength: The ordered layout emphasizes drop-off between stages. Readers instantly see where volume is lost.
- Use when: Sales decks, marketing reports, onboarding analysis, investor updates.
Bar Chart
- Best for: Comparing independent categories without implying a sequence.
- Strength: Flexible, works for rankings, time comparisons, and multi-series data.
- Use when: Revenue by region, product comparisons, team performance benchmarks.
AECharts supports both. Switch between funnel and bar to find the right format for your data.
How to Create a Funnel Chart
Choose a template. Browse funnel chart templates and pick one that matches your style.
Paste your data. Copy from Excel or Google Sheets. One row per stage with a value. AECharts builds the funnel automatically.
Customize colors and style. Assign a color to each stage and match your brand. Adjust fonts and background.
Export. Export and drop it directly into PowerPoint, Google Slides, or reports.