Gantt Chart Maker, Create Editable Gantt Charts Free Online
Paste a task list and get an editable Gantt chart slide, not a static template you fill in by hand. Built for engagement workplans, deal timelines, and rollout plans you present to clients. Not the tool you manage day-to-day work from. Free to start.
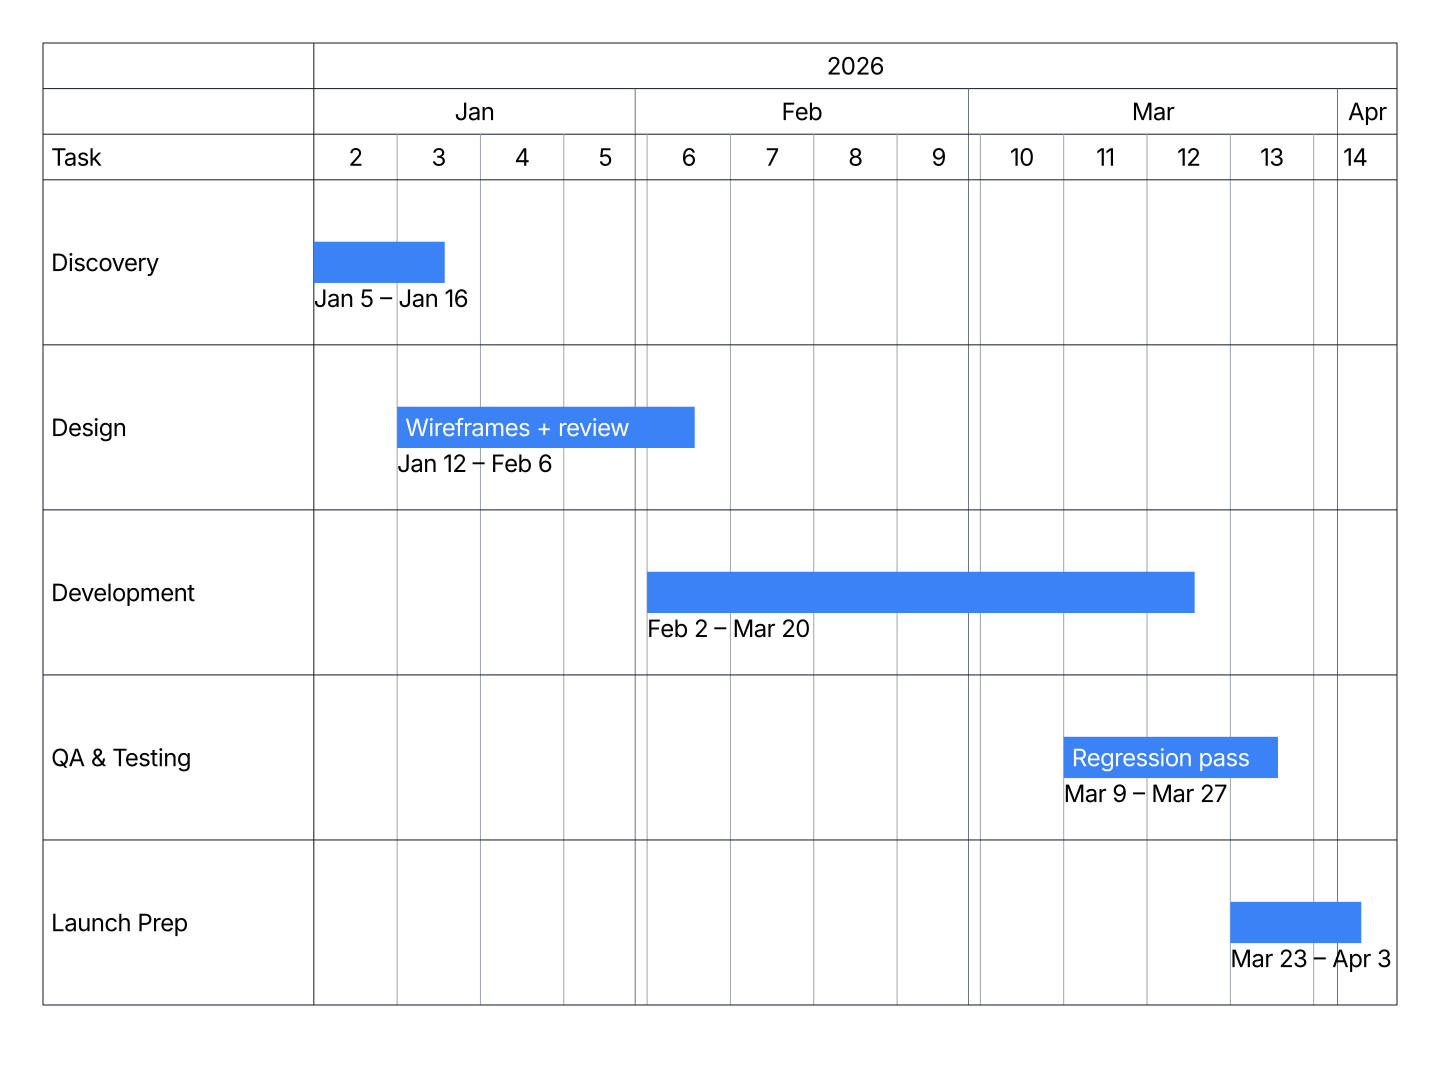
Built From Your Data, Not a Static Template
Most Gantt chart templates for PowerPoint or Google Slides are boxes and text positioned by hand. Change one date and every bar after it needs to be manually resized and redrawn. AECharts works from your data instead: paste a task list with start and end dates, and the bars, calendar header, and date range all calculate automatically. Move a deadline by editing the date, not by dragging a shape.
When to Use a Gantt Chart
Gantt charts work best when you need to show a plan unfolding over time. What happens when, and how the pieces line up.
- Engagement Workplan: Lay out every phase of a client engagement, discovery, design, build, rollout, as a single timeline for the kickoff deck.
- Deal Timeline: Map signing, diligence, and close milestones across a transaction so stakeholders see the path to close at a glance.
- Implementation Roadmap: Show a phased rollout plan for a client-facing initiative, with milestones marking each go-live date.
- Workstream Plan: Line up parallel workstreams across an engagement so the client sees how each team's work overlaps and depends on timing.
- Status Update Timeline: Re-present the original workplan against current progress, shading holiday freezes or delays that shifted the schedule.
- Product Launch Plan: Sequence research, build, and launch activities with milestones for review gates and the launch date itself.
Gantt Chart vs Spreadsheet
Both hold the same task list, but they answer different questions.
Gantt Chart
- Best for: Showing a plan visually. How tasks line up, overlap, and stack against the calendar.
- Strength: A room reads a timeline in seconds. Dates and durations that take a paragraph to explain in a table become obvious as bar positions and lengths.
- Use when: Presenting a workplan, deal timeline, or rollout plan to a client or stakeholder.
Spreadsheet
- Best for: Managing the plan. Editing dates, tracking owners, sorting and filtering tasks.
- Strength: Fast to edit and easy to keep as the single source of truth for the underlying data.
- Use when: Building or updating the task list itself, before it's ready to present.
AECharts is built for the second step, turning that spreadsheet into the timeline you actually present.
How to Create a Gantt Chart
Choose a template. Browse Gantt chart templates and pick one that matches your style.
Paste your task list. Copy from Excel or Google Sheets. One row per task with a start and end date. AECharts builds the timeline automatically.
Set headers, milestones & style. Stack the header tiers you need, mark milestones, shade date ranges, and set colors to match your brand.
Export. Export and drop it directly into PowerPoint, Google Slides, or reports.