Advanced chart maker
for business presentations
Build Waterfall, Mekko, Pareto, Stacked Column, Bubble and more from spreadsheets or AI prompts.
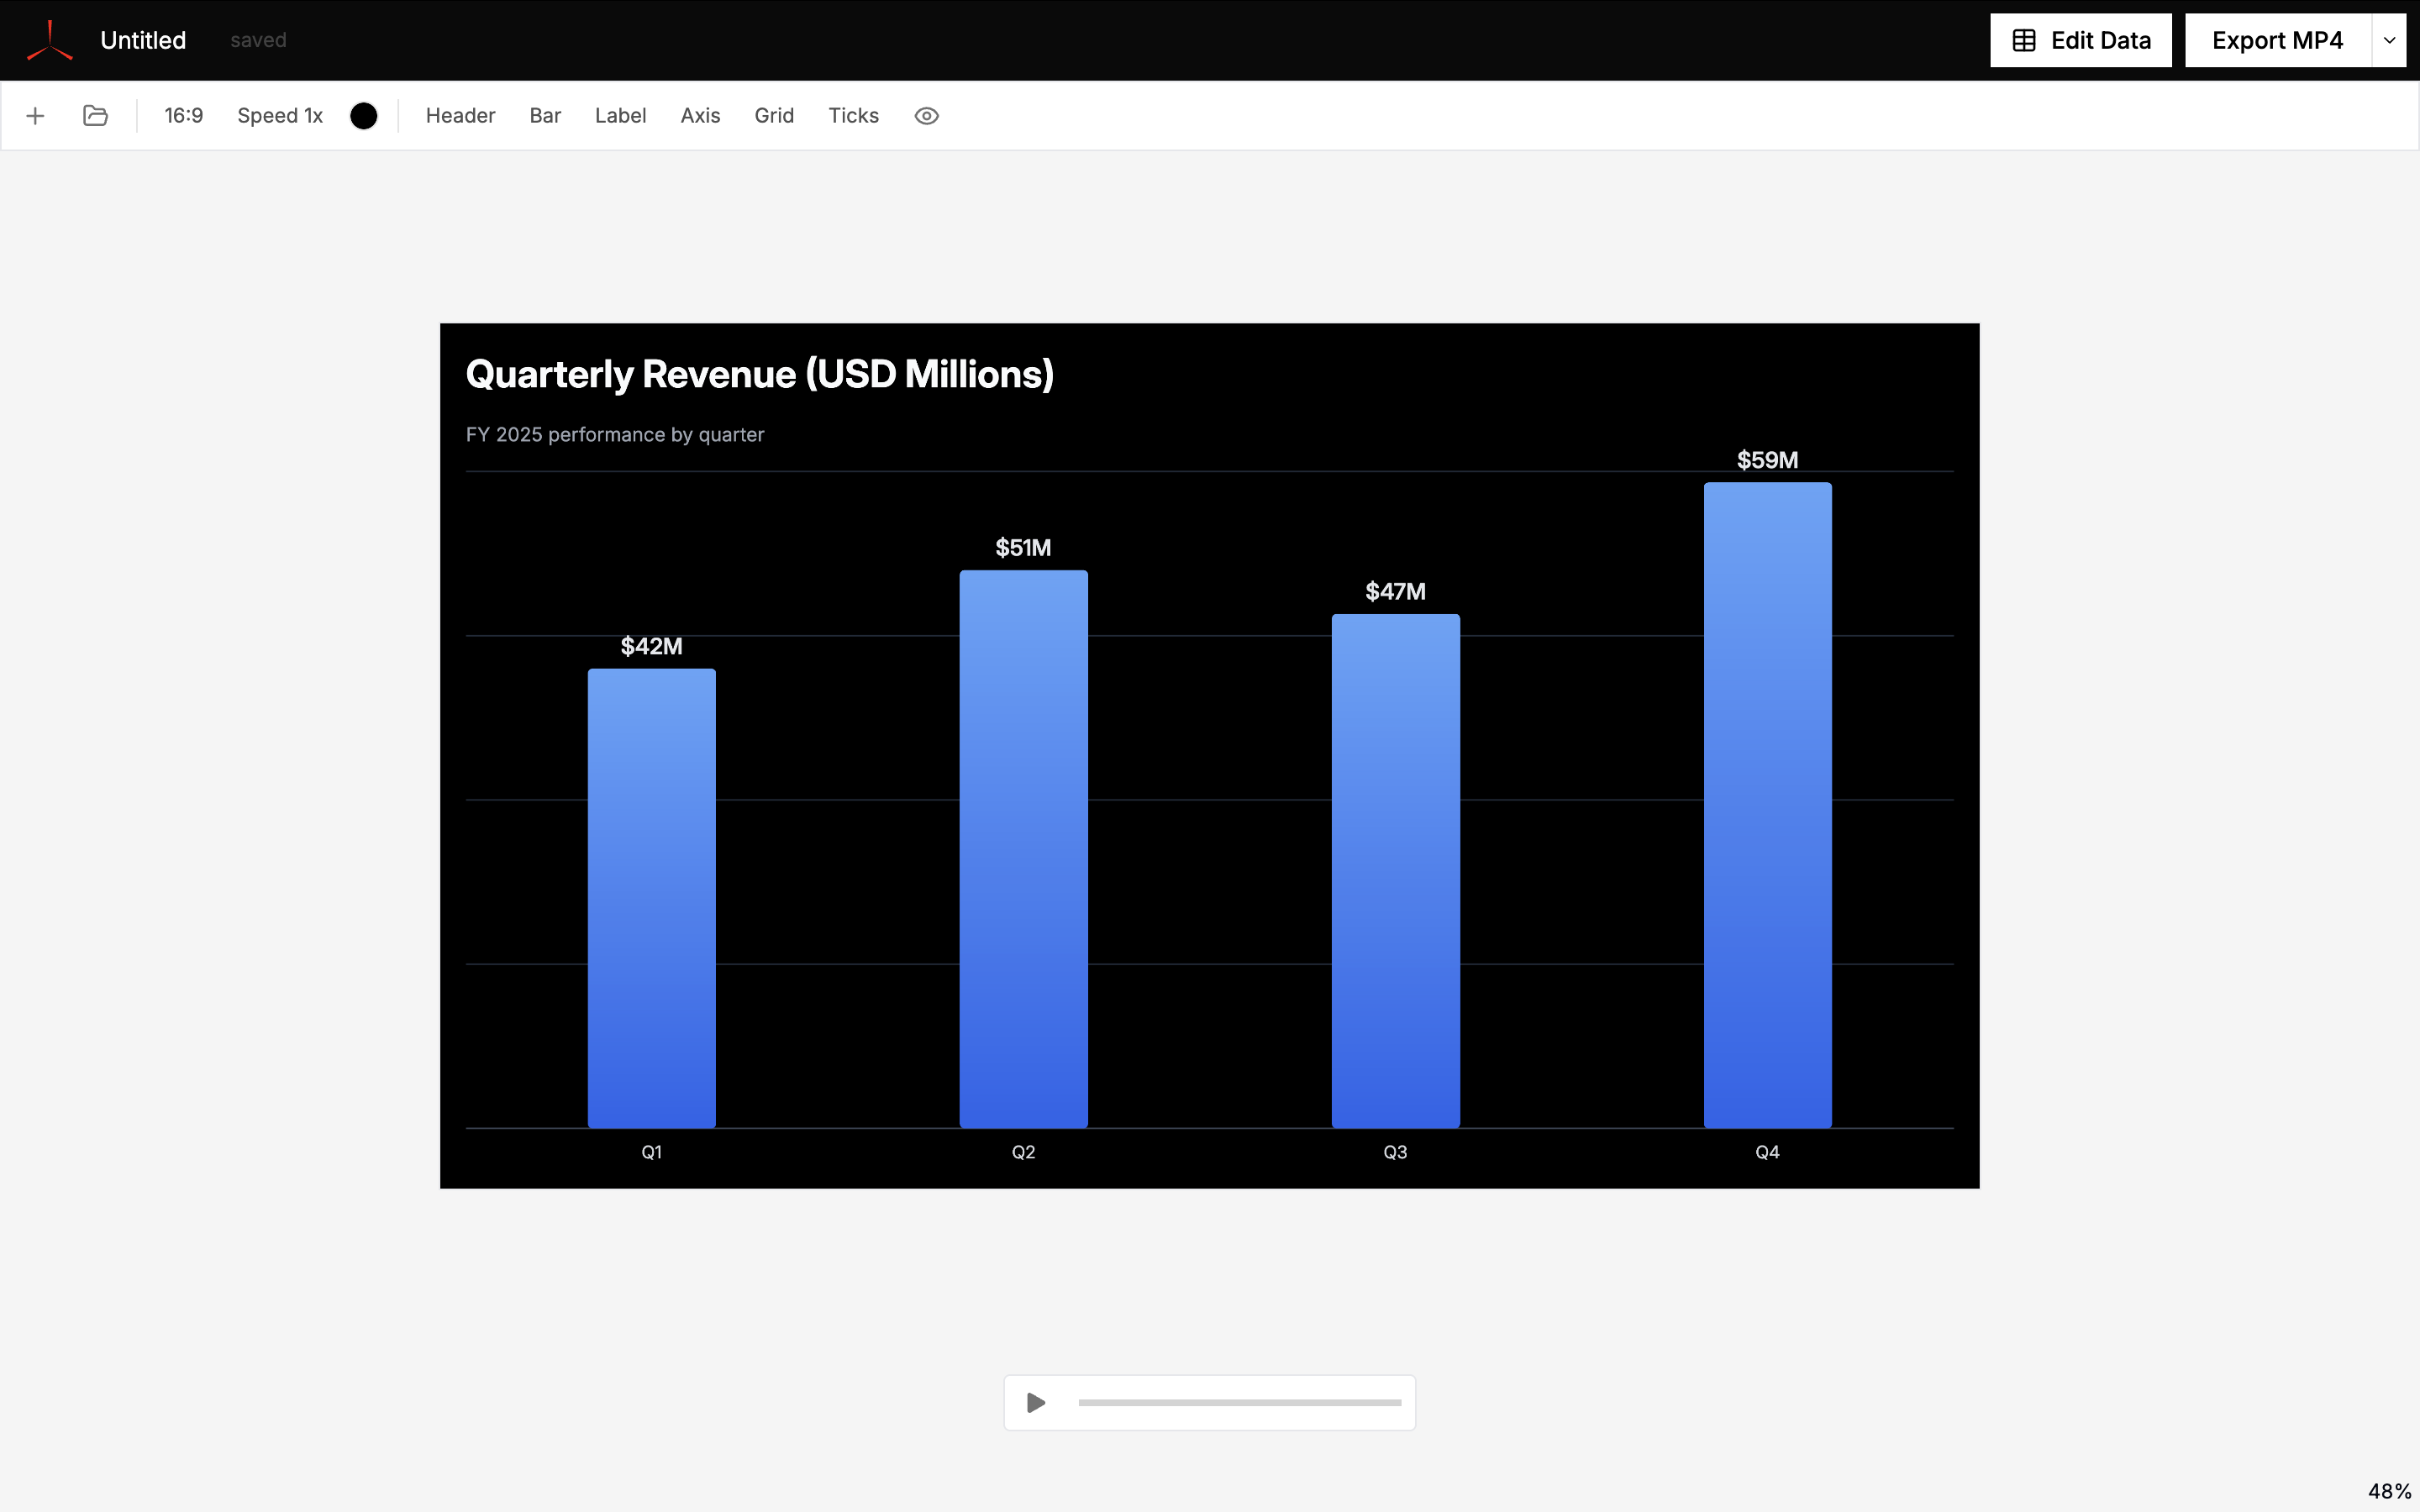
Used by individuals from





Advanced chart types for business decks.
Create the chart types consultants, analysts, and finance teams use when PowerPoint and Excel get painful: waterfall, Marimekko, Pareto, funnel, dumbbell, radar, waffle, treemap, and gauge.
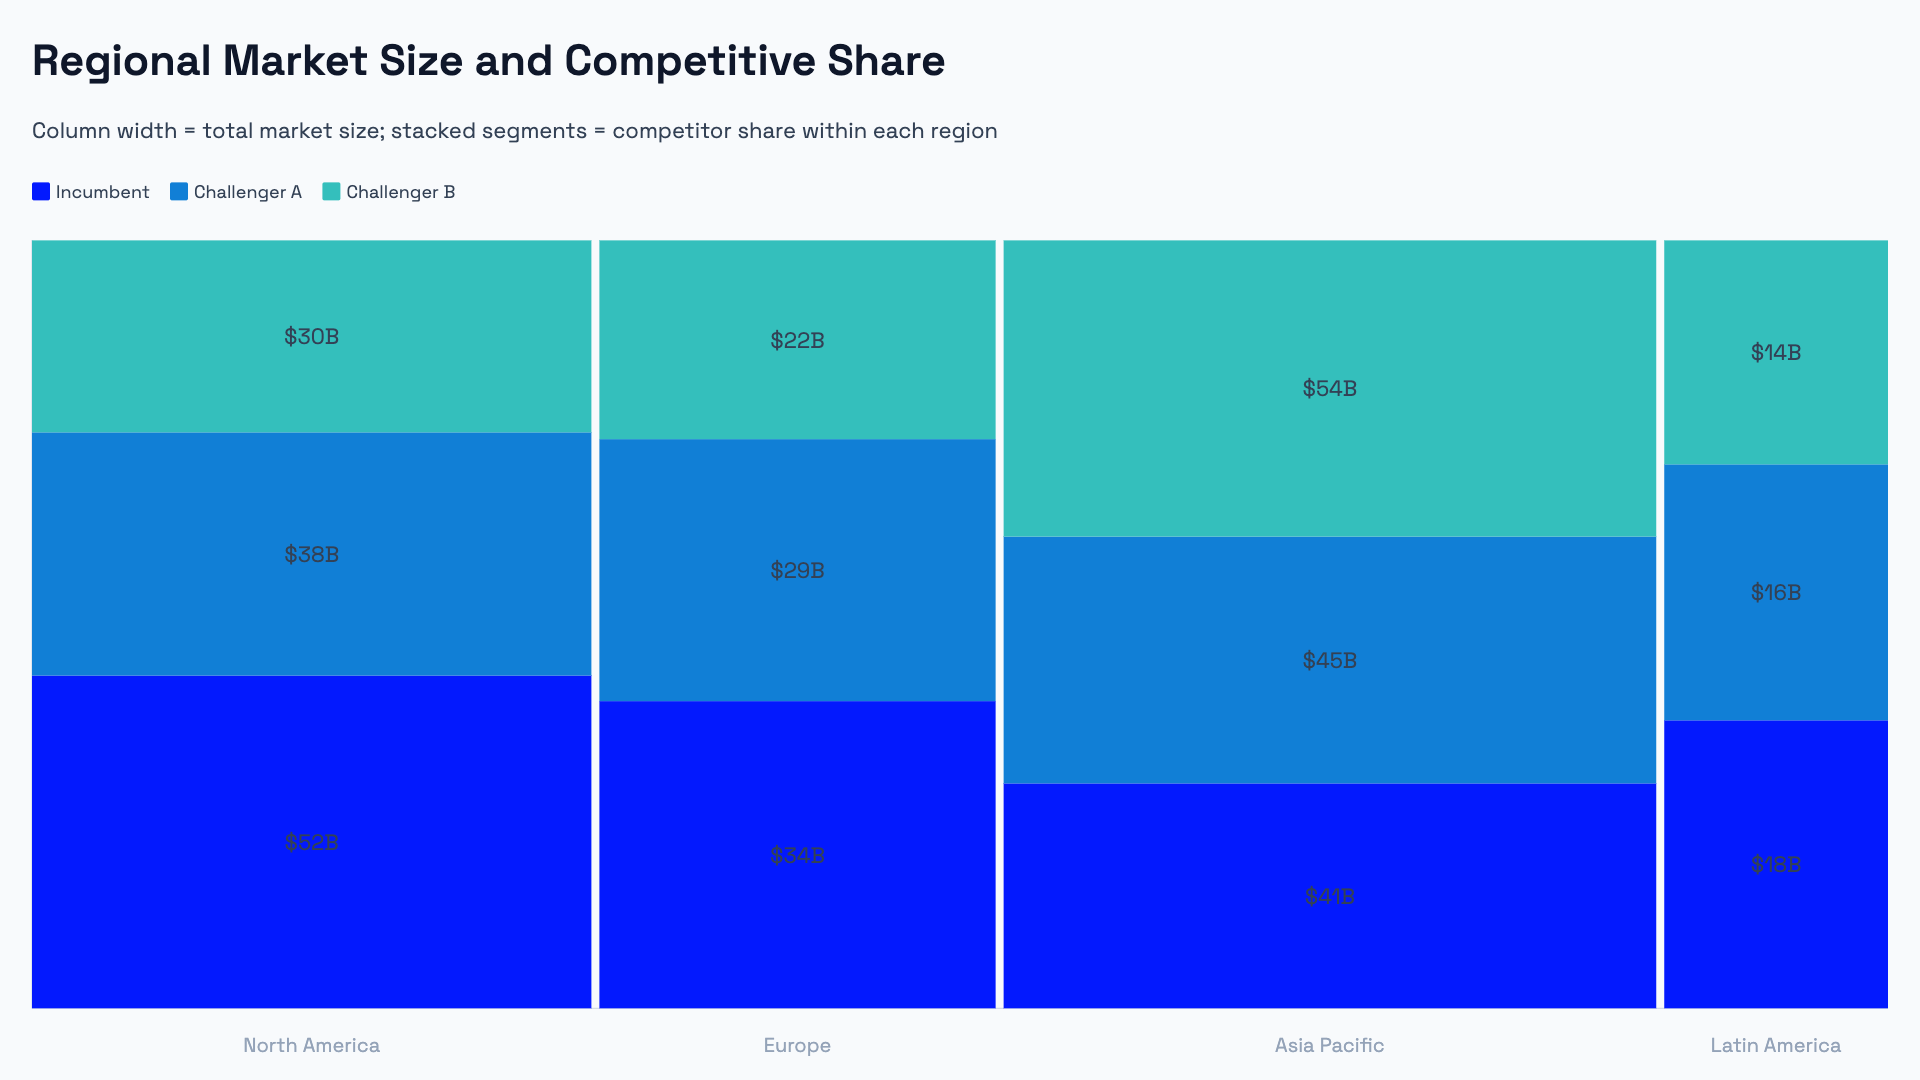
Start from a spreadsheet or an AI prompt.
Paste data from Excel or Google Sheets, import a CSV, or describe the chart you want. AECharts helps turn your data or prompt into an editable business chart.


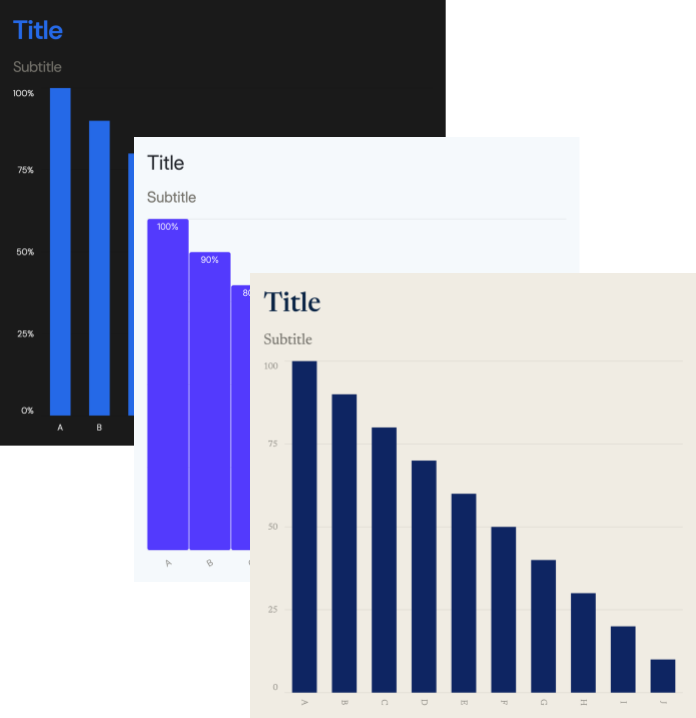
Full control over styling and brand.
Fonts, colors, label formats, axis ranges — every visual property is editable. Team plans include a Brand Kit that applies your settings across all charts.
Smart presentation diagrams.
Timeline, cycle, hub-and-spoke, and process flow diagrams that dynamically adjust their layout as you add or remove items — no manual repositioning.
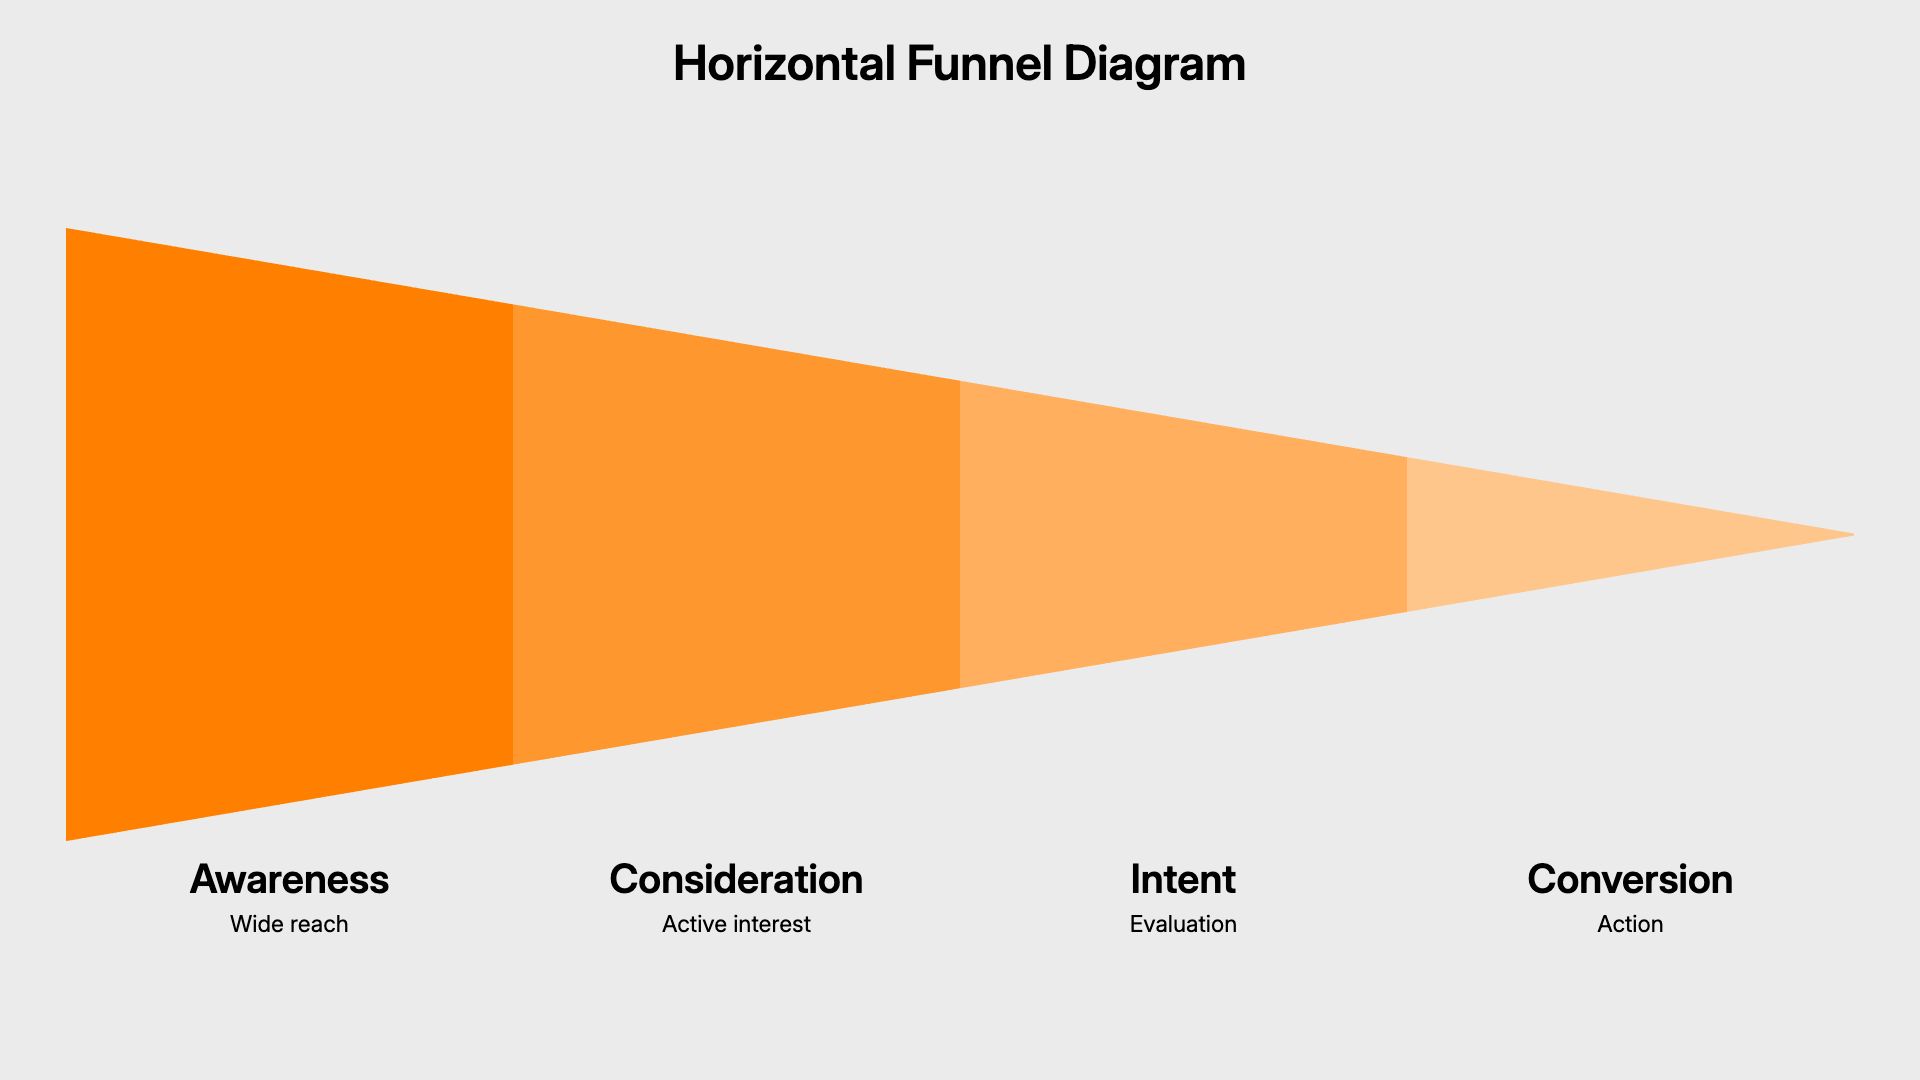
Supported business chart types
Supported presentation diagrams
How to create charts and diagrams with AECharts
Choose a business chart type — waterfall, Marimekko, Pareto, funnel, dumbbell, and more.
Add data or describe the chart — paste from Excel, Google Sheets, or CSV, or use an AI prompt to create a first draft.
Customize and download — edit labels, colors, fonts, and axes, then export as PDF or PNG.
Built for people who make business decks
- Consultants building client presentations
- Analysts and finance teams creating recurring reports
- Founders preparing investor updates
- Sales and marketing teams visualizing funnels and performance