RAWGraphs vs AECharts: Static vs Animated Chart Maker
Comparing RAWGraphs and AECharts for data visualization. See which chart tool is best for static analysis vs animated social media content.
Our users' charts regularly get 100,000+ views on social media
See the Difference
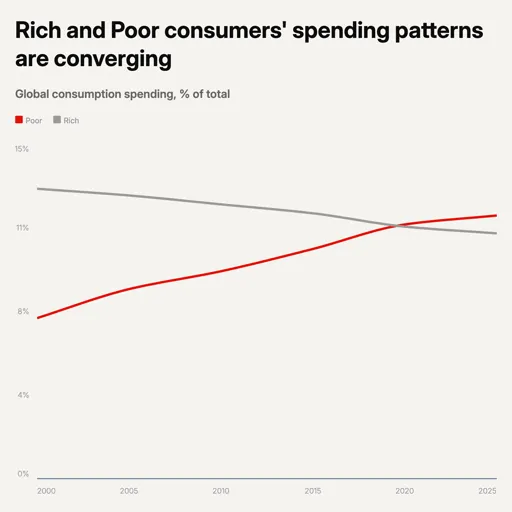
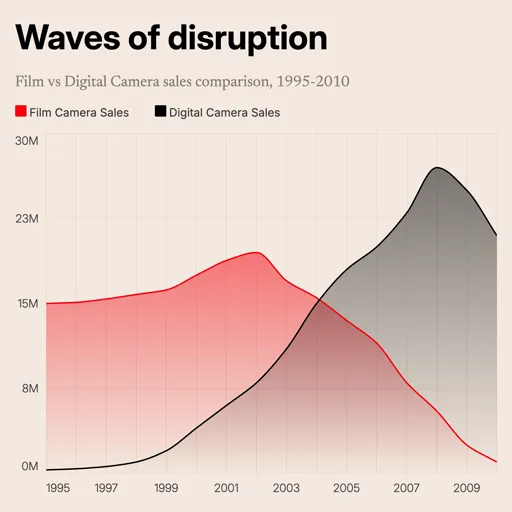
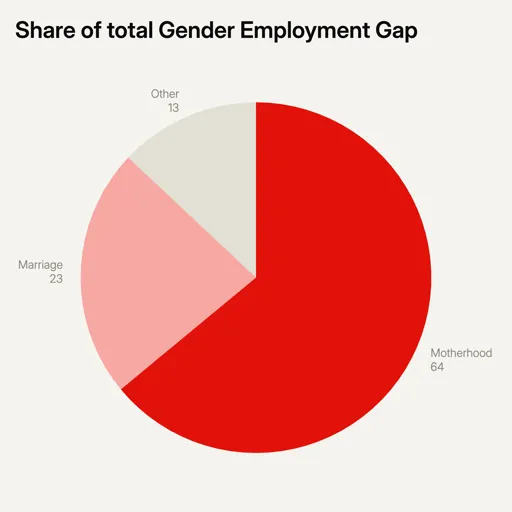
Same data, different results. Compare charts made with RAWGraphs vs AECharts.

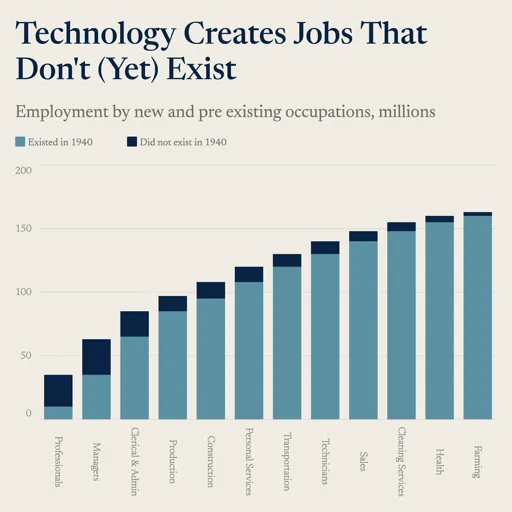
Bar chart comparison — same data, different impact
With RAWGraphs
- —No animation capability — static images only
- —No video export — stuck with SVG and PNG
- —No social media format presets
- —Charts look academic, not eye-catching
- —Requires additional tools to animate output
Who creates with AECharts
Creators and teams who need polished chart content — fast, on-brand, and ready to publish.
Founders & startup teams
Share growth metrics, revenue updates, and portfolio insights in investor emails, slides, and announcements.
Finance creators & analysts
Post market breakdowns and trend analysis on LinkedIn, X, and Instagram.
Newsletter writers & researchers
Embed editorial charts in Substack, Beehiiv, Ghost, and research blogs.
NGOs & impact teams
Present impact data in annual reports, websites, and public disclosures.
Feature Comparison
| Feature | RAWGraphs | AECharts |
|---|---|---|
| Animation | Static output only | Full timeline animations |
| Video Export | Not available (SVG/PNG) | MP4, PNG, shareable link |
| Social Formats | Custom dimensions (static) | 9:16, 1:1, 16:9 presets |
| Visual Style | Academic/analytical | Modern, attention-grabbing |
| Workflow | Export to edit elsewhere | Complete in one tool |
| Target Use | Print and analysis | Social media content |
Pricing
Full access to all features, unlimited exports
Open source. No animation or video export at any price.
Export Options
FAQ
AECharts is built for content creators and marketers who want eye-catching chart content. If you need data visualization tools, dashboards, or BI software, this isn't the right tool.
Ready to create charts that stand out?
Animated, branded chart content. Export as MP4, PNG, or share instantly — no motion design skills needed.