Semicircle Pie Chart Maker, Create Half Pie Charts Online for Free
Paste your data, pick a template, and export and use in PowerPoint or Google Slides. Built for dashboard KPIs, survey results, portfolio splits, and any time a full circle takes up too much space. Free to start.
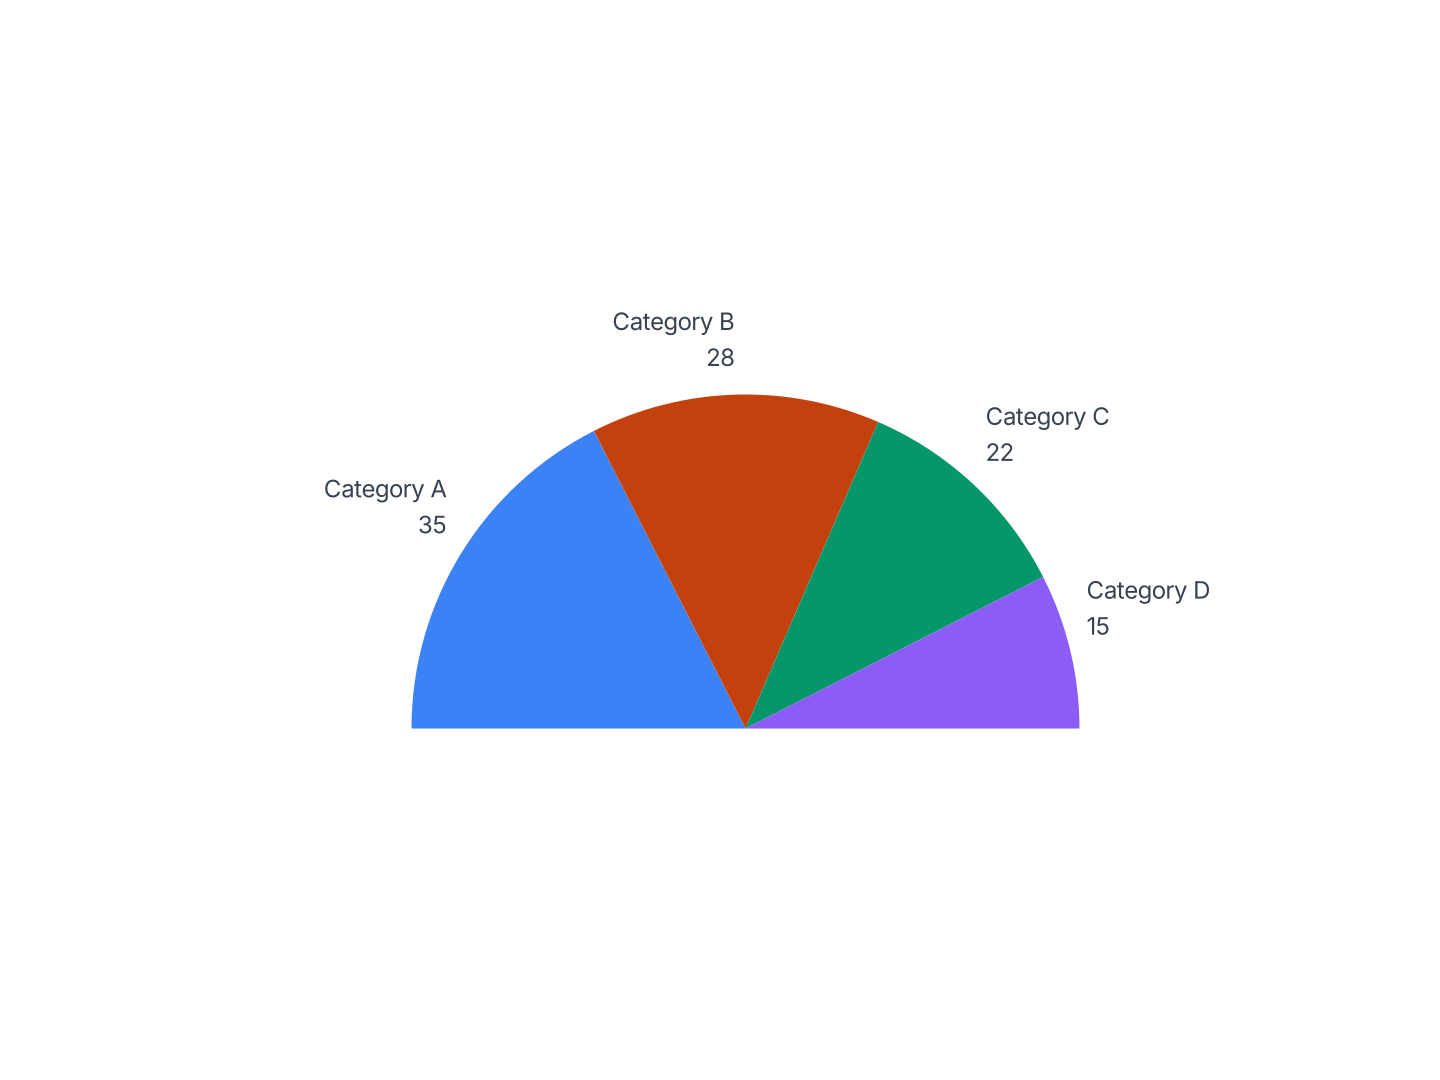
When to Use a Semicircle Pie Chart
Semicircle charts work best when you have 2–4 proportional categories and need a compact format that fits in a constrained layout.
- Dashboard KPIs: A 3-segment semicircle fits cleanly in a dashboard card alongside a headline number. The flat base anchors the chart visually in a way a full pie circle doesn't.
- Survey Results: Agree / Neutral / Disagree across a half-arc. The compact format lets you stack multiple survey questions on a single slide without crowding.
- Portfolio Allocation: Equities, bonds, and cash in three segments fanning outward. The semicircle fits naturally in a two-column report layout next to portfolio commentary.
- Market Share: Your share vs competitors in a half-circle. The flat bottom edge creates a natural anchor that makes the dominant segment feel stable and authoritative.
- Budget Split: Marketing, headcount, and infrastructure across the arc. Easier to fit in a slide than a full pie when you need supporting annotations below.
- Infographic Callout: A single prominent percentage in a half-pie format works as a standalone visual in a report or editorial infographic, more refined than a full circle.
Semicircle Pie Chart vs Full Pie Chart
Both show part-to-whole proportions, but the format affects where they fit.
Semicircle (Half Pie)
- Best for: 2–4 categories in wide or card-style layouts where vertical space is limited.
- Strength: Flat baseline anchors the chart visually, looks intentional in two-column slides and dashboard panels.
- Use when: Dashboard cards, two-column slides, infographic callouts, or alongside headline metrics.
Full Pie Chart
- Best for: 3–6 categories where the circular format and familiar shape aid quick recognition.
- Strength: Compact and universally understood, every audience knows how to read a pie chart.
- Use when: Standalone charts, budget breakdowns, portfolio allocation, category splits with more than 3 items.
AECharts supports both. Switch between half-pie and full pie to find the right format for your layout.
How to Create a Semicircle Pie Chart
Choose a Template. Browse semicircle pie chart templates and pick one that fits your data.
Paste Your Data. Copy from Excel or Google Sheets. One row per category with a value. AECharts builds the half-pie segments automatically.
Customize Colors & Style. Assign a color to each segment and match your brand. Adjust fonts, labels, and background.
Export. Export and drop it directly into PowerPoint, Google Slides, or reports.