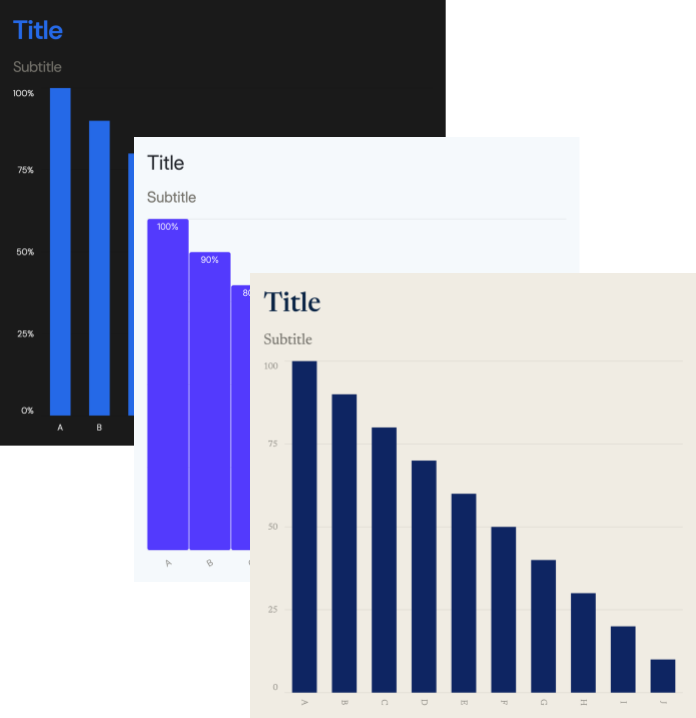
Create professional
charts and business graphics
Try it, no login required
Used by individuals from


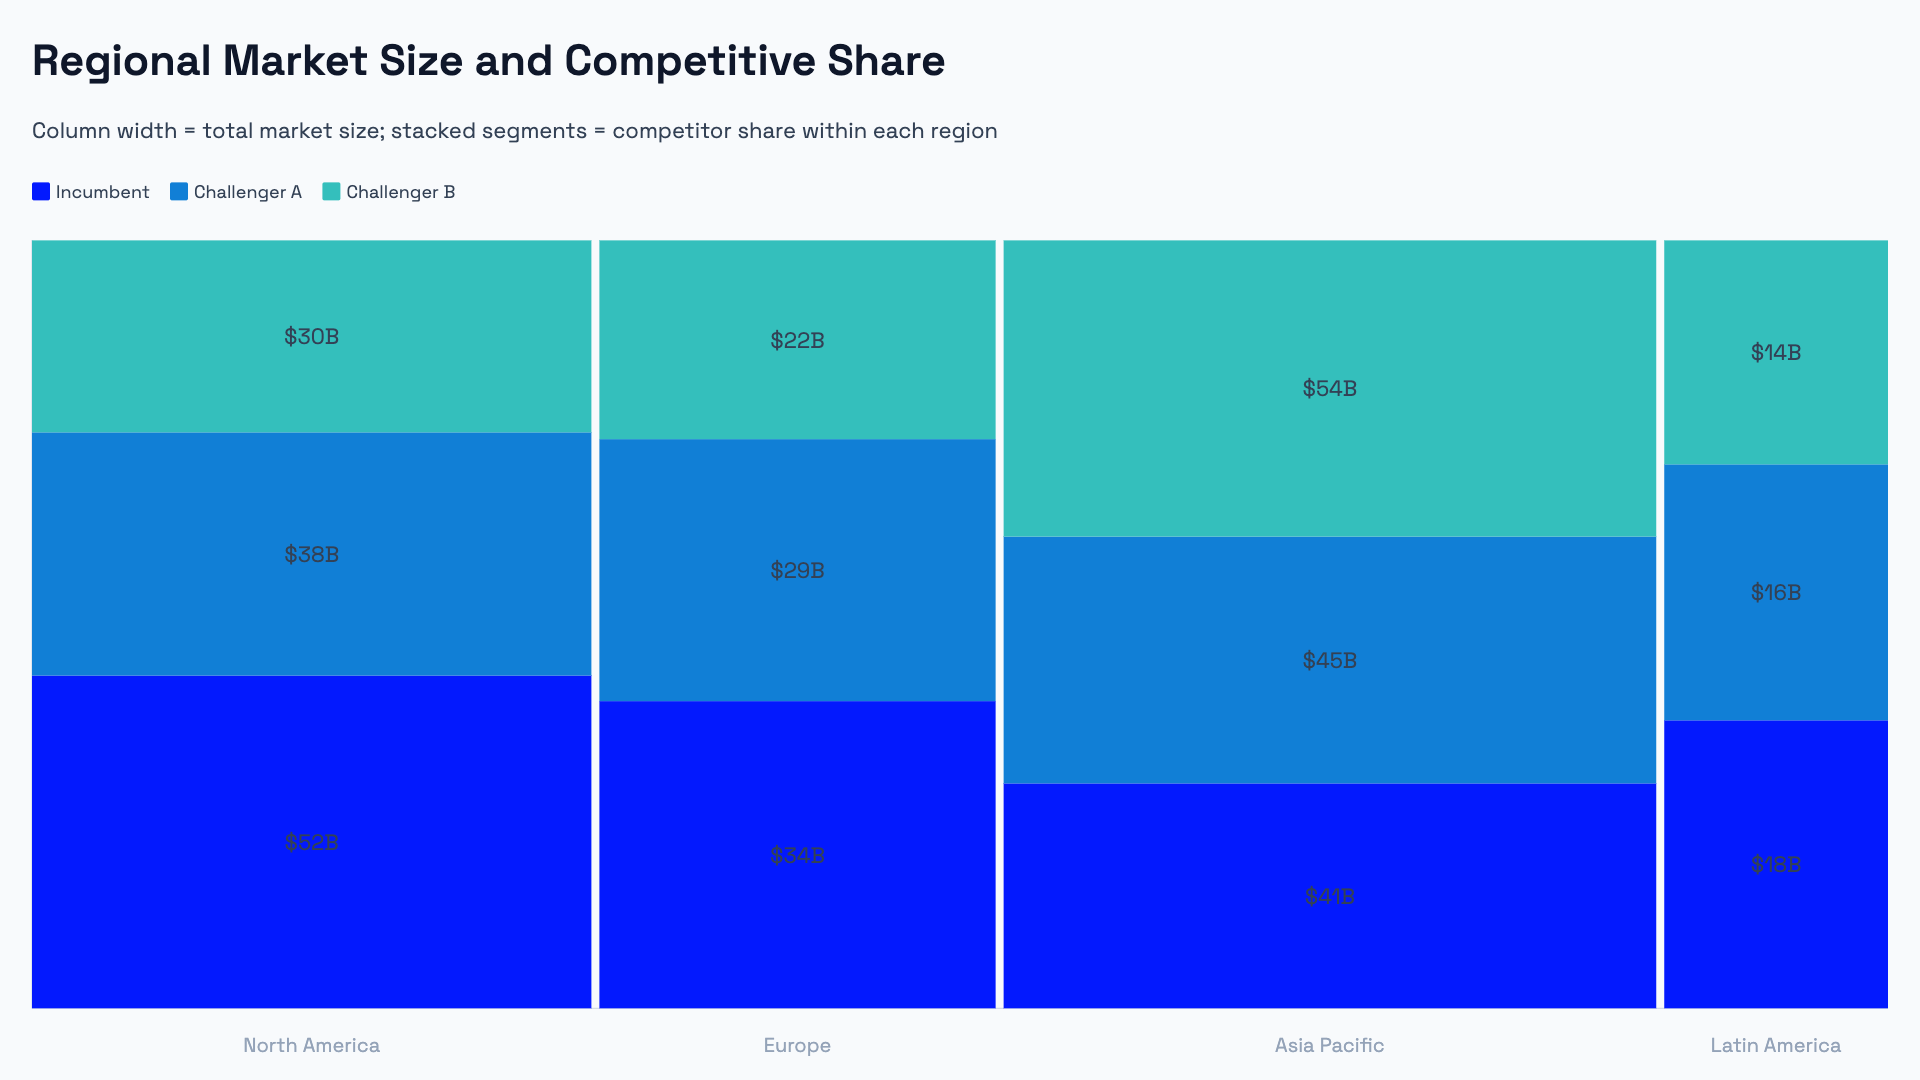
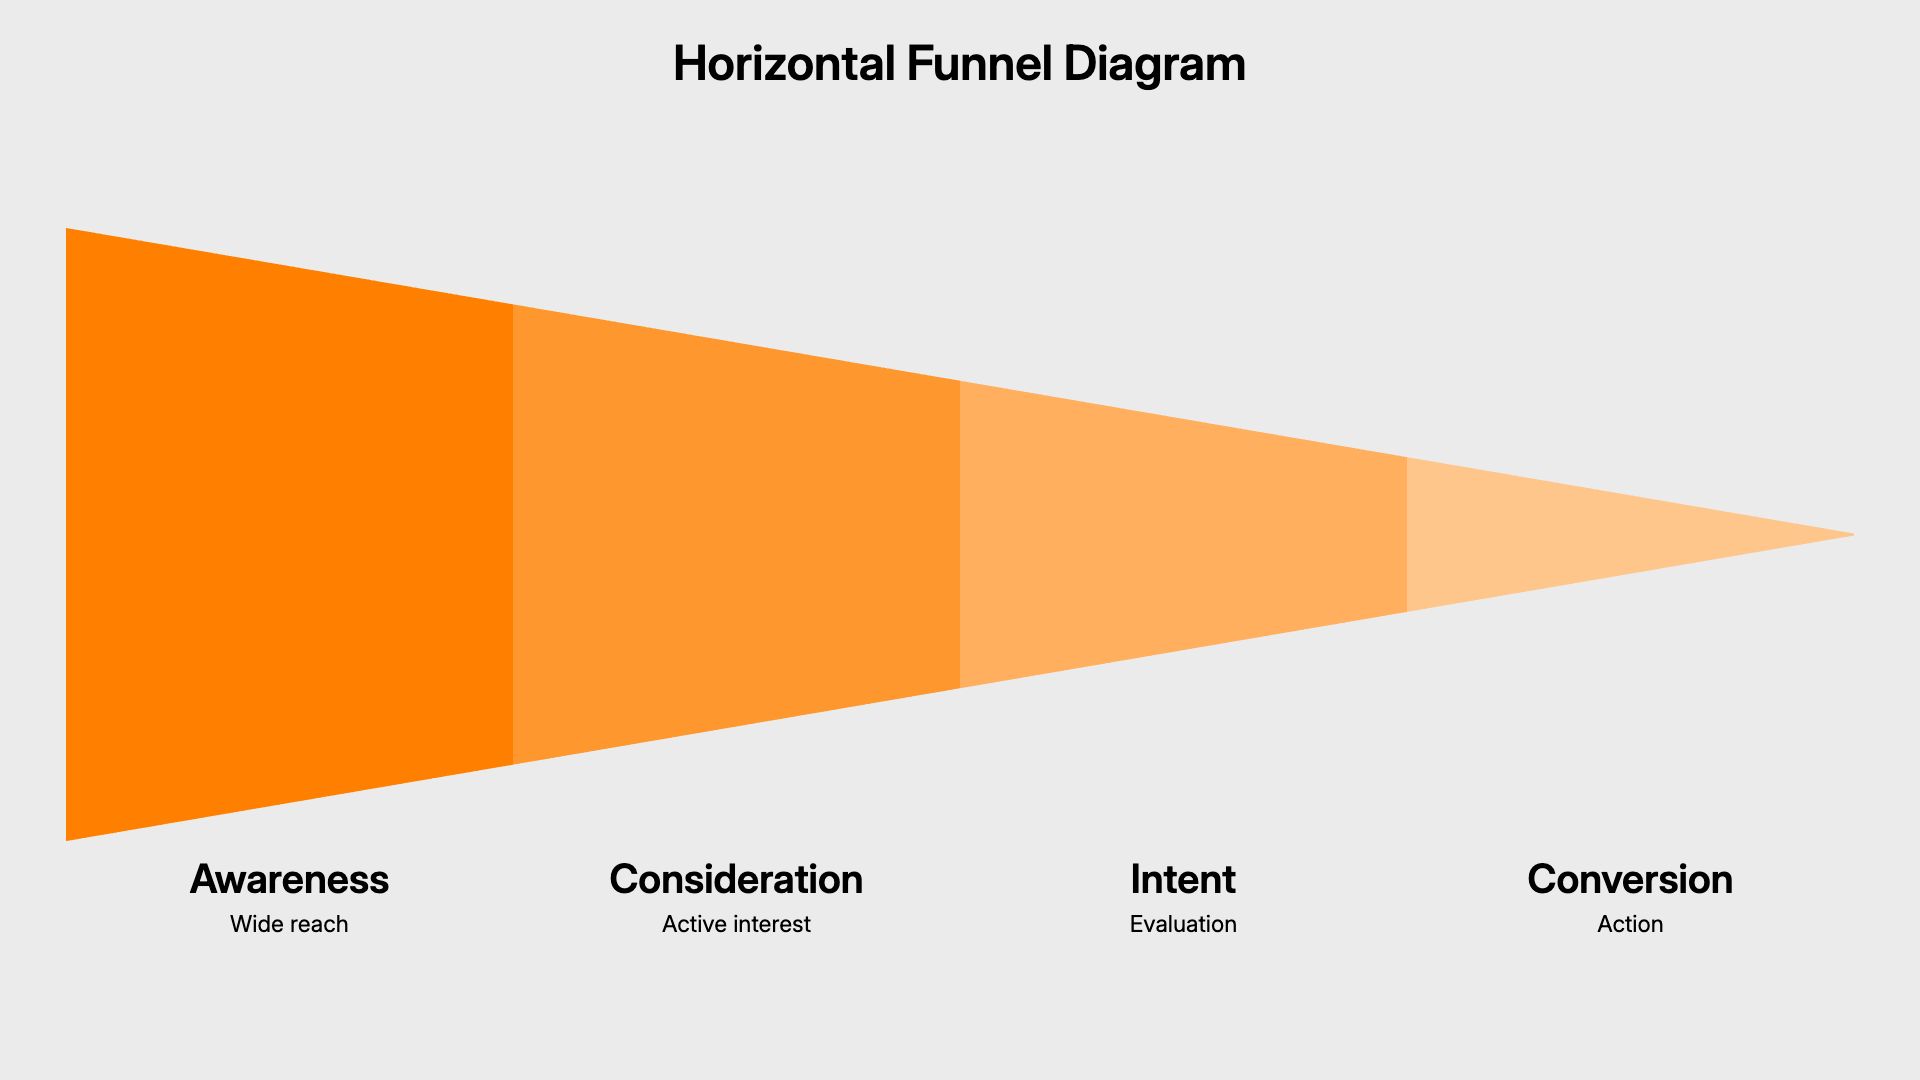
Advanced chart types built for business.
Waterfall, Marimekko, Pareto, dumbbell, radar, and funnel charts — the chart types analysts and consultants use in client decks, but that PowerPoint and Google Slides don't support natively.
Presentation diagrams that reflow.
Timeline, cycle, hub-and-spoke, and process flow diagrams that recalculate their layout as you add or remove items — no manual repositioning.
Import data from Excel, Google Sheets, or CSV.
Paste directly from a spreadsheet or import a CSV file. AECharts maps your columns to the chart automatically.
Full control over styling and brand.
Fonts, colors, label formats, axis ranges — every visual property is editable. Team plans include a Brand Kit that applies your settings across all charts.
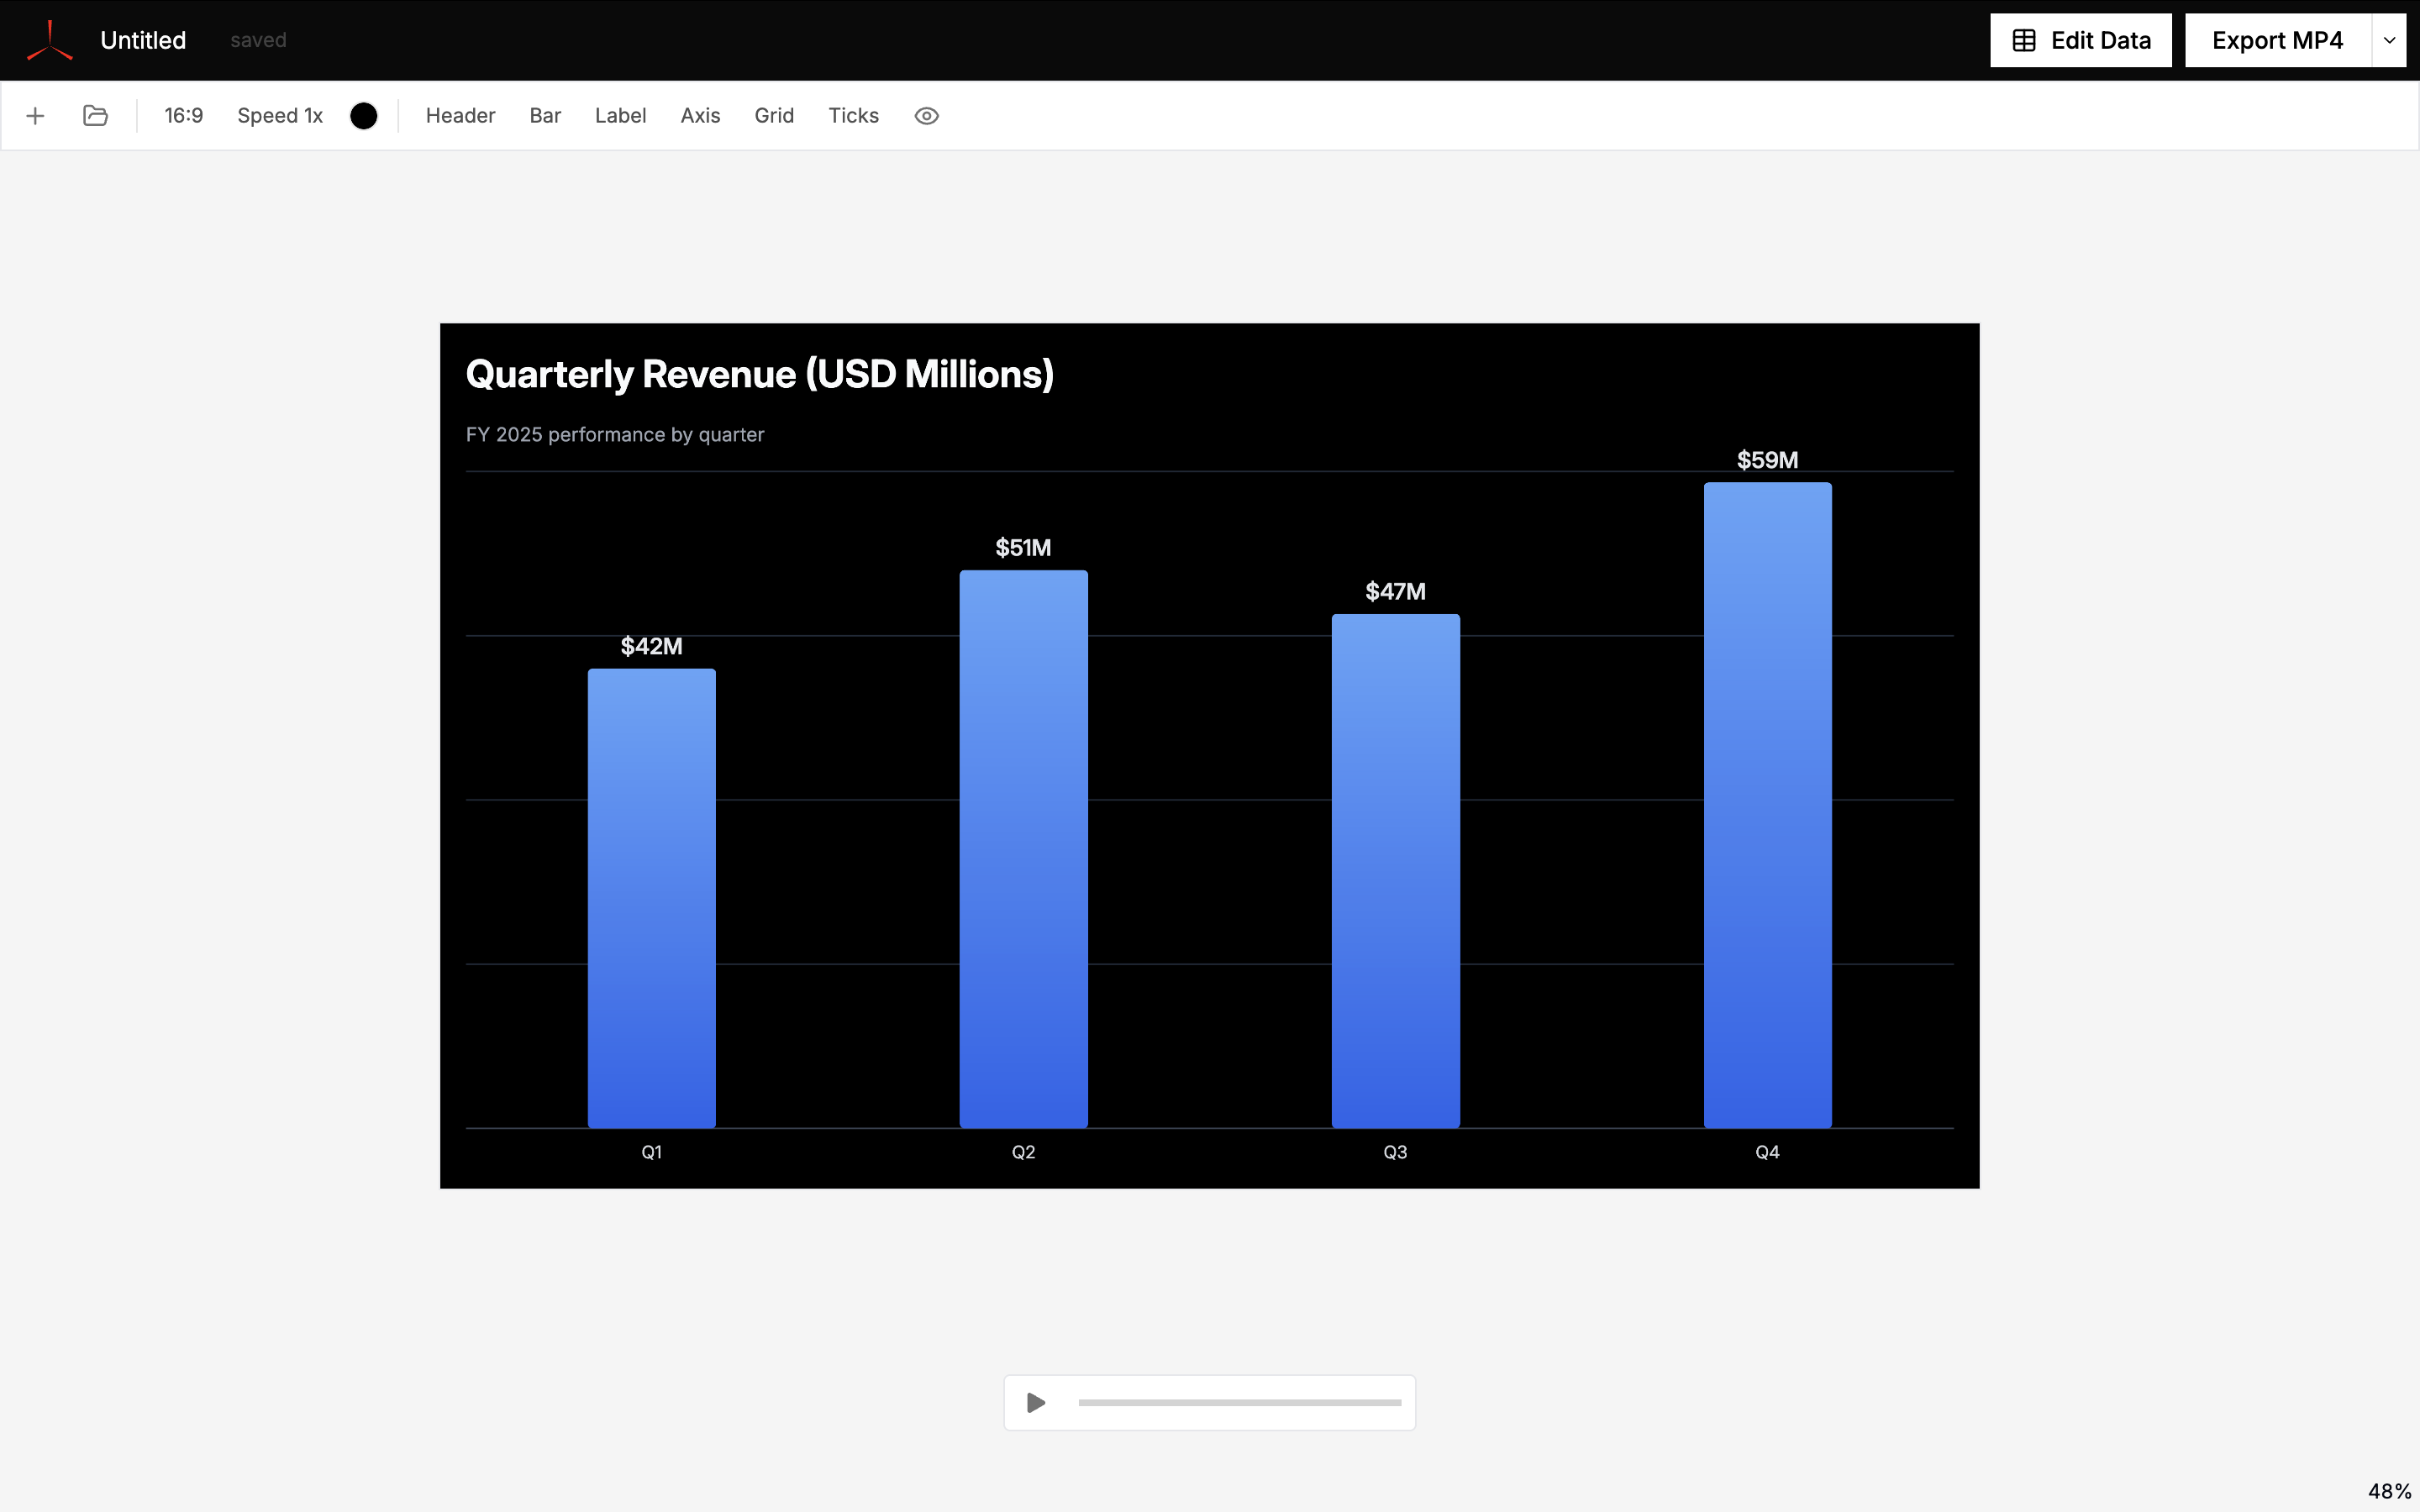
Charts animate by default.
Every chart plays a smooth reveal animation out of the box. For static exports like PowerPoint or PNG, the animation is skipped and you get the final chart state.
Export to PowerPoint, Google Slides, PNG, or MP4.
All formats render from the same source chart — drop into a client deck as PPTX, share as Google Slides, embed in a report as PNG, or publish as MP4 video.
20+ chart types and presentation diagrams
How to create charts and diagrams with AECharts
Pick one of the chart types — bar, line, pie, donut, scatter, gauge, and more. Each comes with pre-built templates.
Paste data from Excel, Sheets, or CSV![]()
![]() — then edit colors, fonts, labels, and animation speed in the sidebar. Changes preview instantly.
— then edit colors, fonts, labels, and animation speed in the sidebar. Changes preview instantly.
Export as PowerPoint, Google Slides, PNG, or MP4![]()
![]()
![]()