How to Animate a Chart in Google Sheets
Google Sheets has no built-in chart animation. The workaround is to use a Google Apps Script that steps through your data frame by frame while you screen record. Here's how to set it up.
The example we're working with
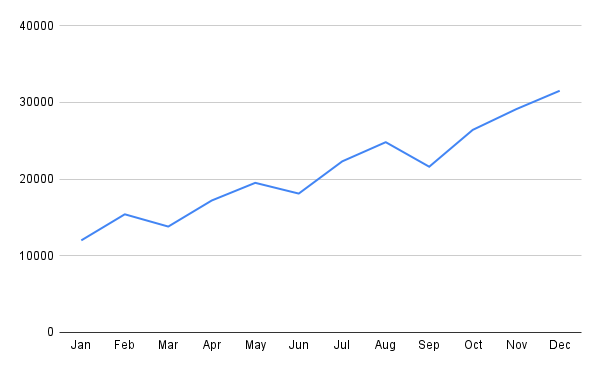
We'll use a simple monthly revenue dataset — 12 months in column A, revenue values in column B. The goal is a line chart that draws itself month by month, revealing one data point at a time.
| A | B | |
|---|---|---|
| 1 | Month | Revenue |
| 2 | Jan | 12000 |
| 3 | Feb | 15400 |
| 4 | Mar | 13800 |
| 5 | Apr | 17200 |
| 6 | May | 19500 |
| 7 | Jun | 18100 |
| 8 | Jul | 22300 |
| 9 | Aug | 24800 |
| 10 | Sep | 21600 |
| 11 | Oct | 26400 |
| 12 | Nov | 29100 |
| 13 | Dec | 31500 |
Select both columns (A1:B13), go to Insert → Chart, and choose Line chart. You should get a static chart like this:
Now we'll make it animate — revealing data points one by one as the script runs.
How to animate it (step by step)
Step 1: Add a helper cell and a display column
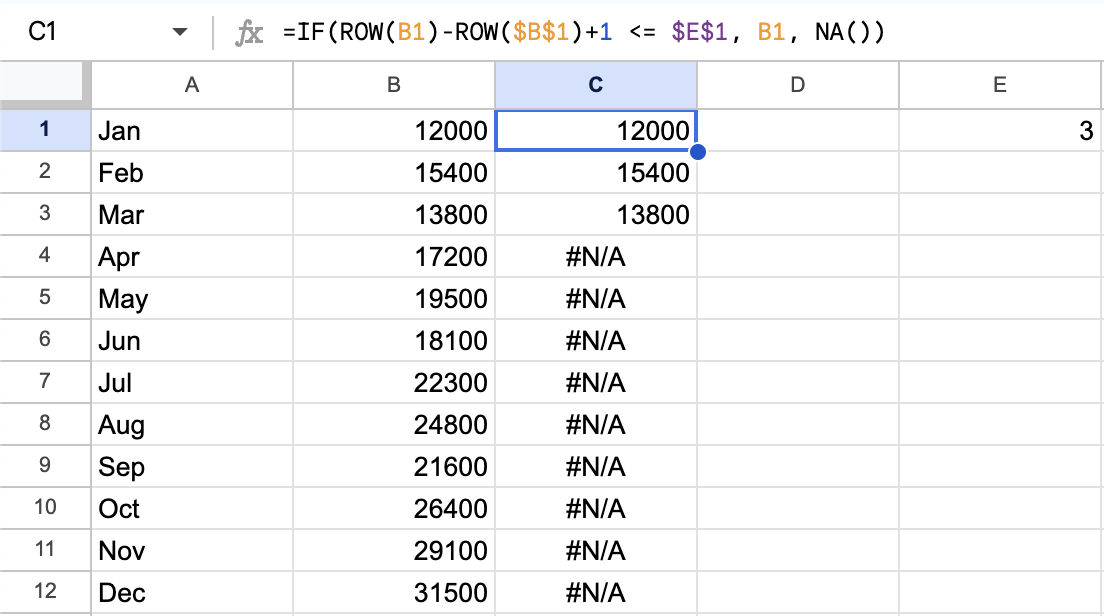
Pick an empty cell — say E1 — to act as the frame counter. Start it at 1.
Next to your data column (say column B), add a display column with this formula in each row:
=IF(ROW(B1)-ROW($B$1)+1 <= $E$1, B1, NA())
This shows the real value if the row is within the current frame count, and returns NA() otherwise. Charts in Google Sheets skip NA() values entirely, so those data points disappear from the chart rather than showing as zero. Build your chart on this display column, not your original data.
Step 2: Write the Apps Script to advance frames
Go to Extensions → Apps Script and add this function:
function playAnimation() {
  const sheet = SpreadsheetApp.getActiveSheet();
  const totalFrames = 12; // number of data rows
  const msPerFrame = 500; // half a second per frame

  for (let i = 1; i <= totalFrames; i++) {
    sheet.getRange("E1").setValue(i);
    SpreadsheetApp.flush(); // force the sheet to redraw
    Utilities.sleep(msPerFrame);
  }
}
SpreadsheetApp.flush() forces the UI to update before sleeping. Without it, changes batch up and the chart won't redraw between frames.
Step 3: Screen record while running the macro
Open your screen recorder (QuickTime on Mac, Xbox Game Bar on Windows, or a third-party tool), start recording focused on the chart, then run the playAnimation function from the Apps Script editor. The chart will step through each frame as the script runs.
Step 4: Trim and export
Stop recording, trim out the setup time at the beginning, and export as MP4. You now have a video of your chart animating through the data.
Why this approach is frustrating
The workaround gets the job done, but comes with real friction:
- —No smooth animation. The chart snaps between states — one frame per sleep interval. There's no easing, no bars growing smoothly, no transition between values. It looks like a slideshow, not an animation.
- —Timing is unreliable.
Utilities.sleep()isn't frame-accurate. Network latency, script execution time, and UI render lag all affect actual frame duration. The animation often runs slower than expected. - —Setup takes 30–60 minutes. Restructuring data, writing the formula, writing the script, and getting everything to work together is non-trivial — especially if you're not familiar with Apps Script.
- —Requires a separate screen recorder. You need a third tool in the workflow. Screen recording introduces compression artifacts and depends on your display resolution and DPI.
- —Hard to iterate. Want to change the speed, add a title, or adjust colors? You're re-recording. There's no "re-export" — every change means running through the whole process again.
- —Limited chart styles. You're stuck with whatever Google Sheets can render. You can't add text that animates in, custom fonts, gradient fills, or anything beyond the built-in chart options.
When this makes sense
The Apps Script approach is worth it if:
- You're already in a Sheets-heavy workflow and don't want to export data anywhere
- It's a one-time recording and you don't need to iterate
- The audience is internal (team meetings, Slack) where rough production quality is fine
- You have coding familiarity and the setup cost feels low
For anything meant to be shared publicly — a LinkedIn post, a client presentation, a YouTube video — the output quality usually isn't good enough to be worth the effort.
A Simpler Way to Create Animated Charts
AECharts is built for exactly this use case. You copy your data from Google Sheets, paste it in, pick a chart type and template, and export as MP4. No scripting, no screen recording, no video editor.
The animations are smooth, you can control speed and timing, and the output is 1080p. It supports bar charts, line charts, pie charts, and bar race charts (where bars reorder over time — something not possible in Sheets at all).
It's worth trying if the Apps Script setup is more work than the final video is worth.
Related
Animated Bar Chart Maker
Create smooth animated bar charts from your data and export as MP4.
Animated Line Chart Maker
Turn time-series data into animated line chart videos.
Export Chart as MP4
How to export animated charts as high-quality video files.
Bar Chart Race Template
Start with a bar race chart template and paste in your Sheets data.