Free Chart Maker — Create Any Chart Online for Free

Create bar charts, line charts, pie charts, scatter plots, funnels, treemaps, and more — free online.

Unlimited PNG image exports. No account required. Paste from Excel or Google Sheets, customize colors and fonts, and download. Animated MP4 video export available on Pro ($12/month).
Create Bar Chart for Free

Bar chart example

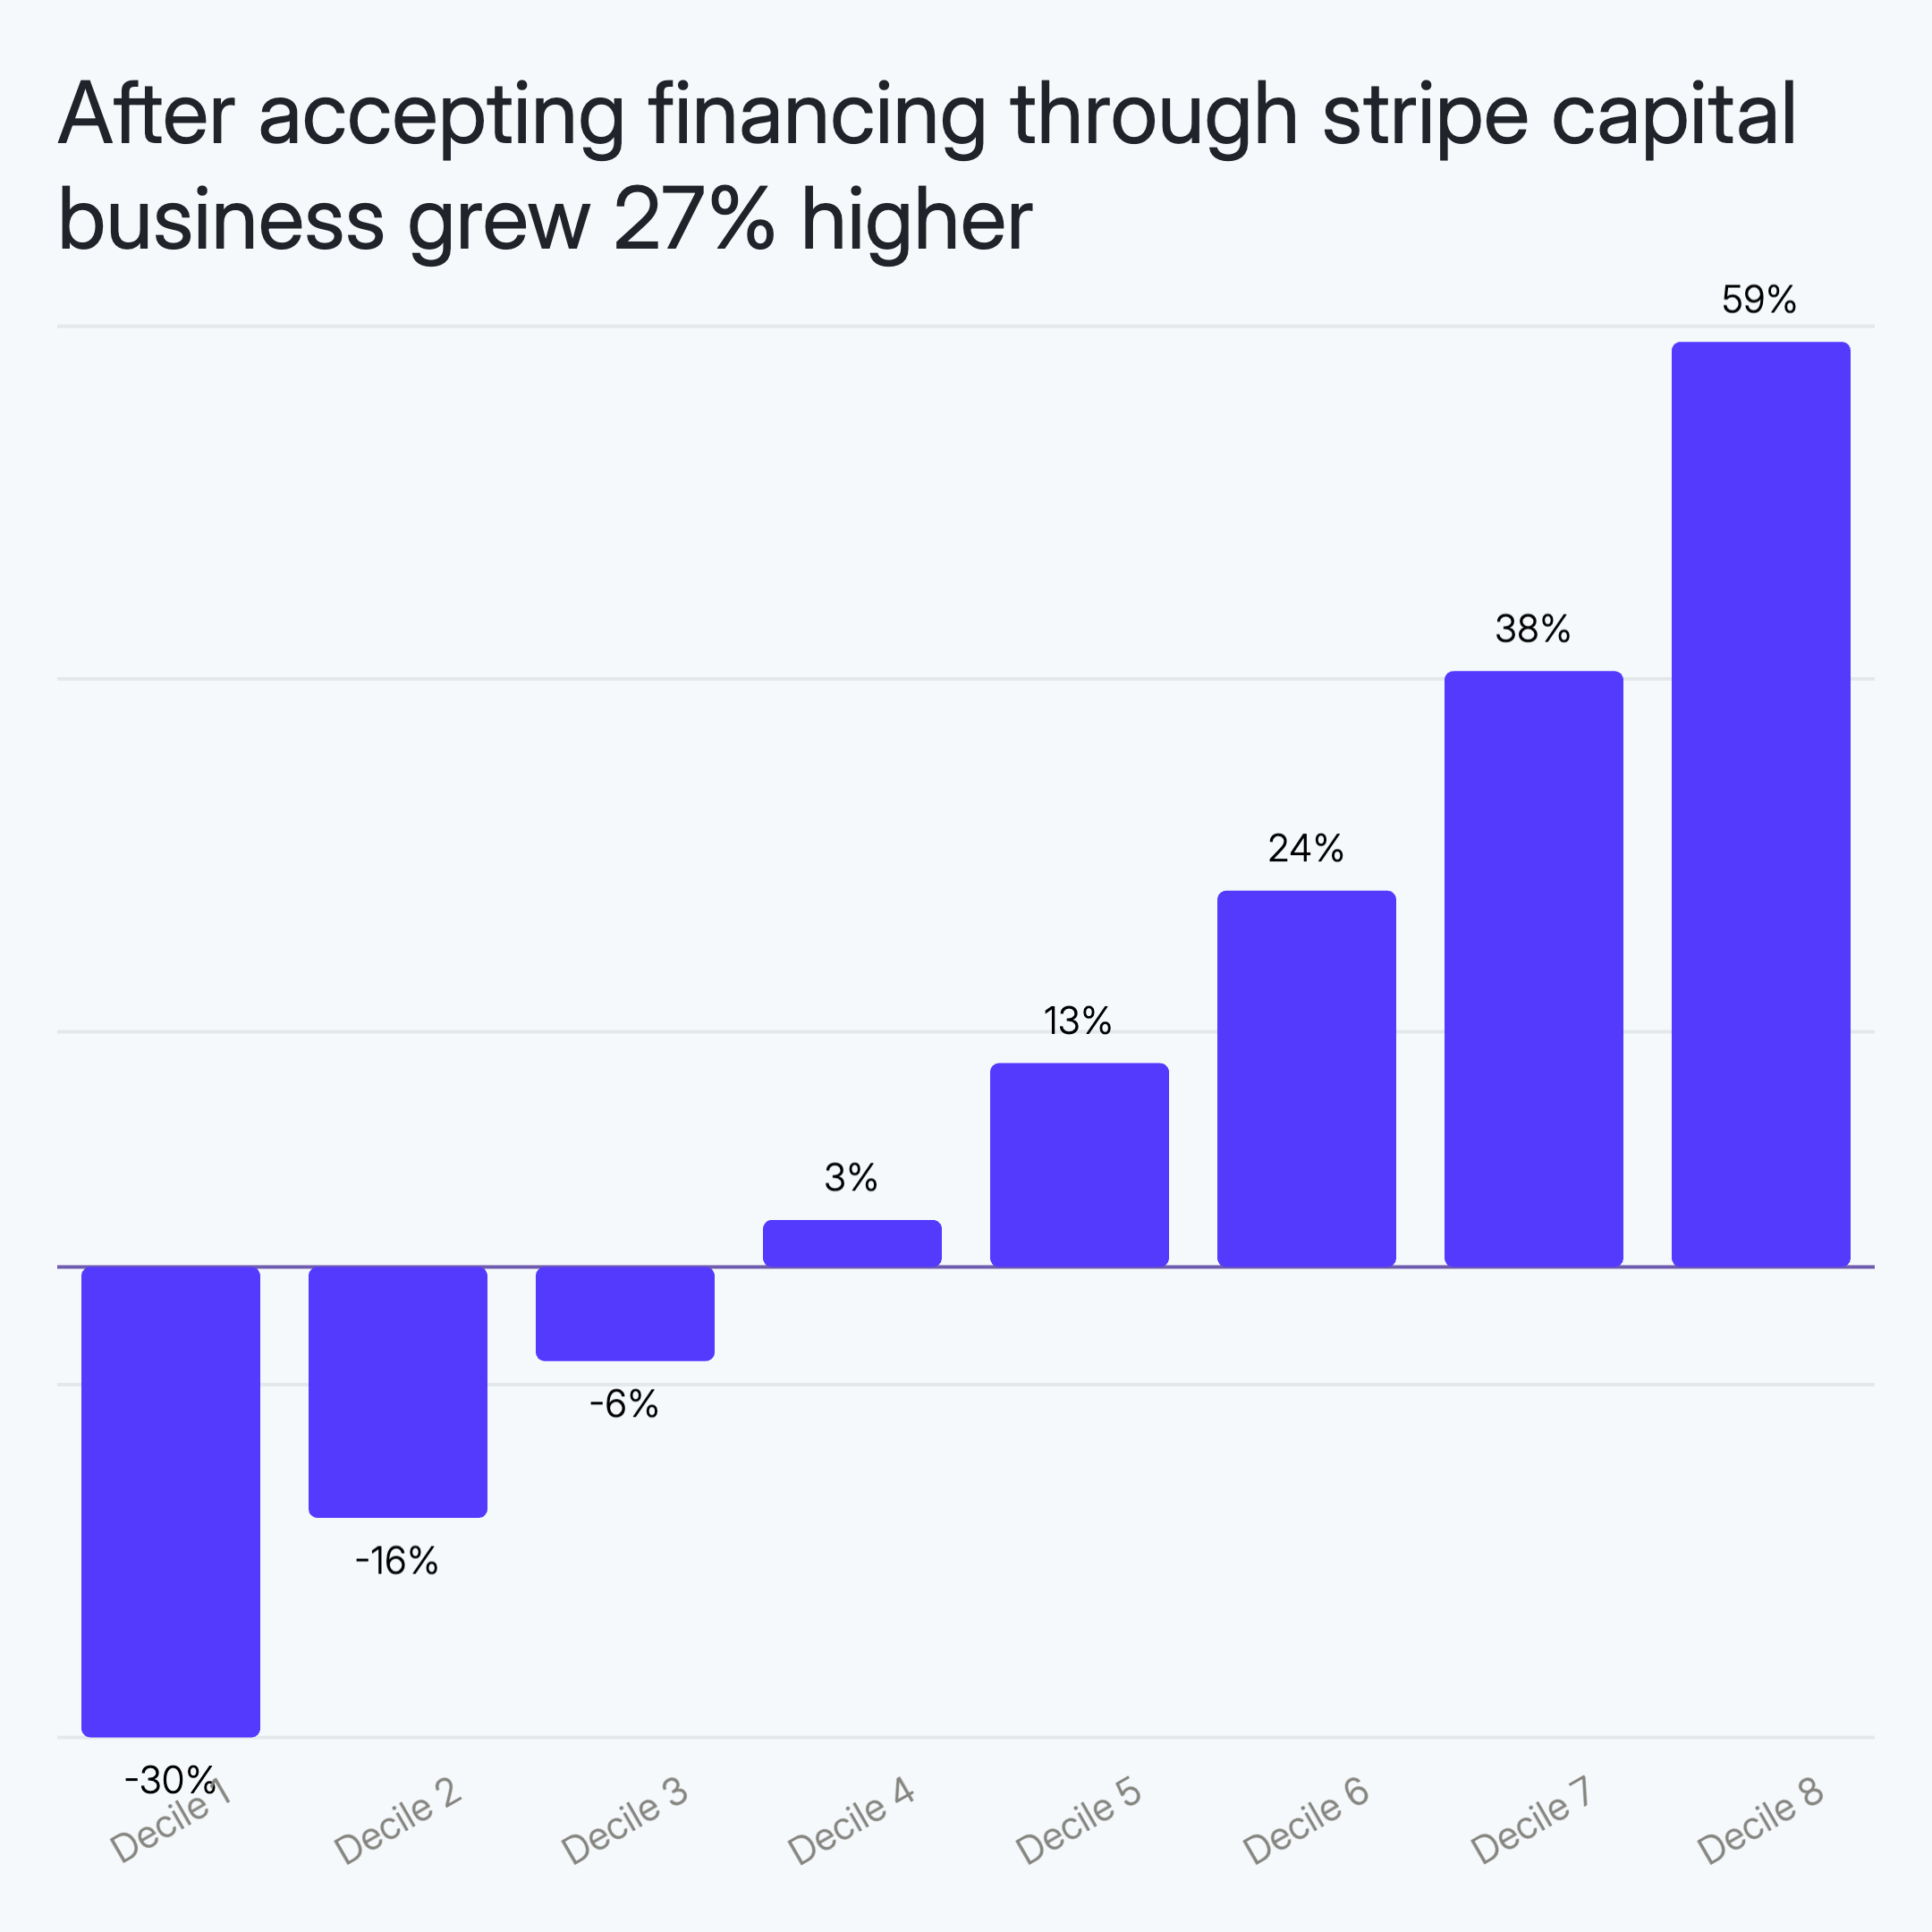
Compare values across categories. Columns grow from a zero baseline — ideal for rankings, survey results, and side-by-side comparisons. Paste two columns from Excel: label and value.

Create Line Chart for Free

Line chart example

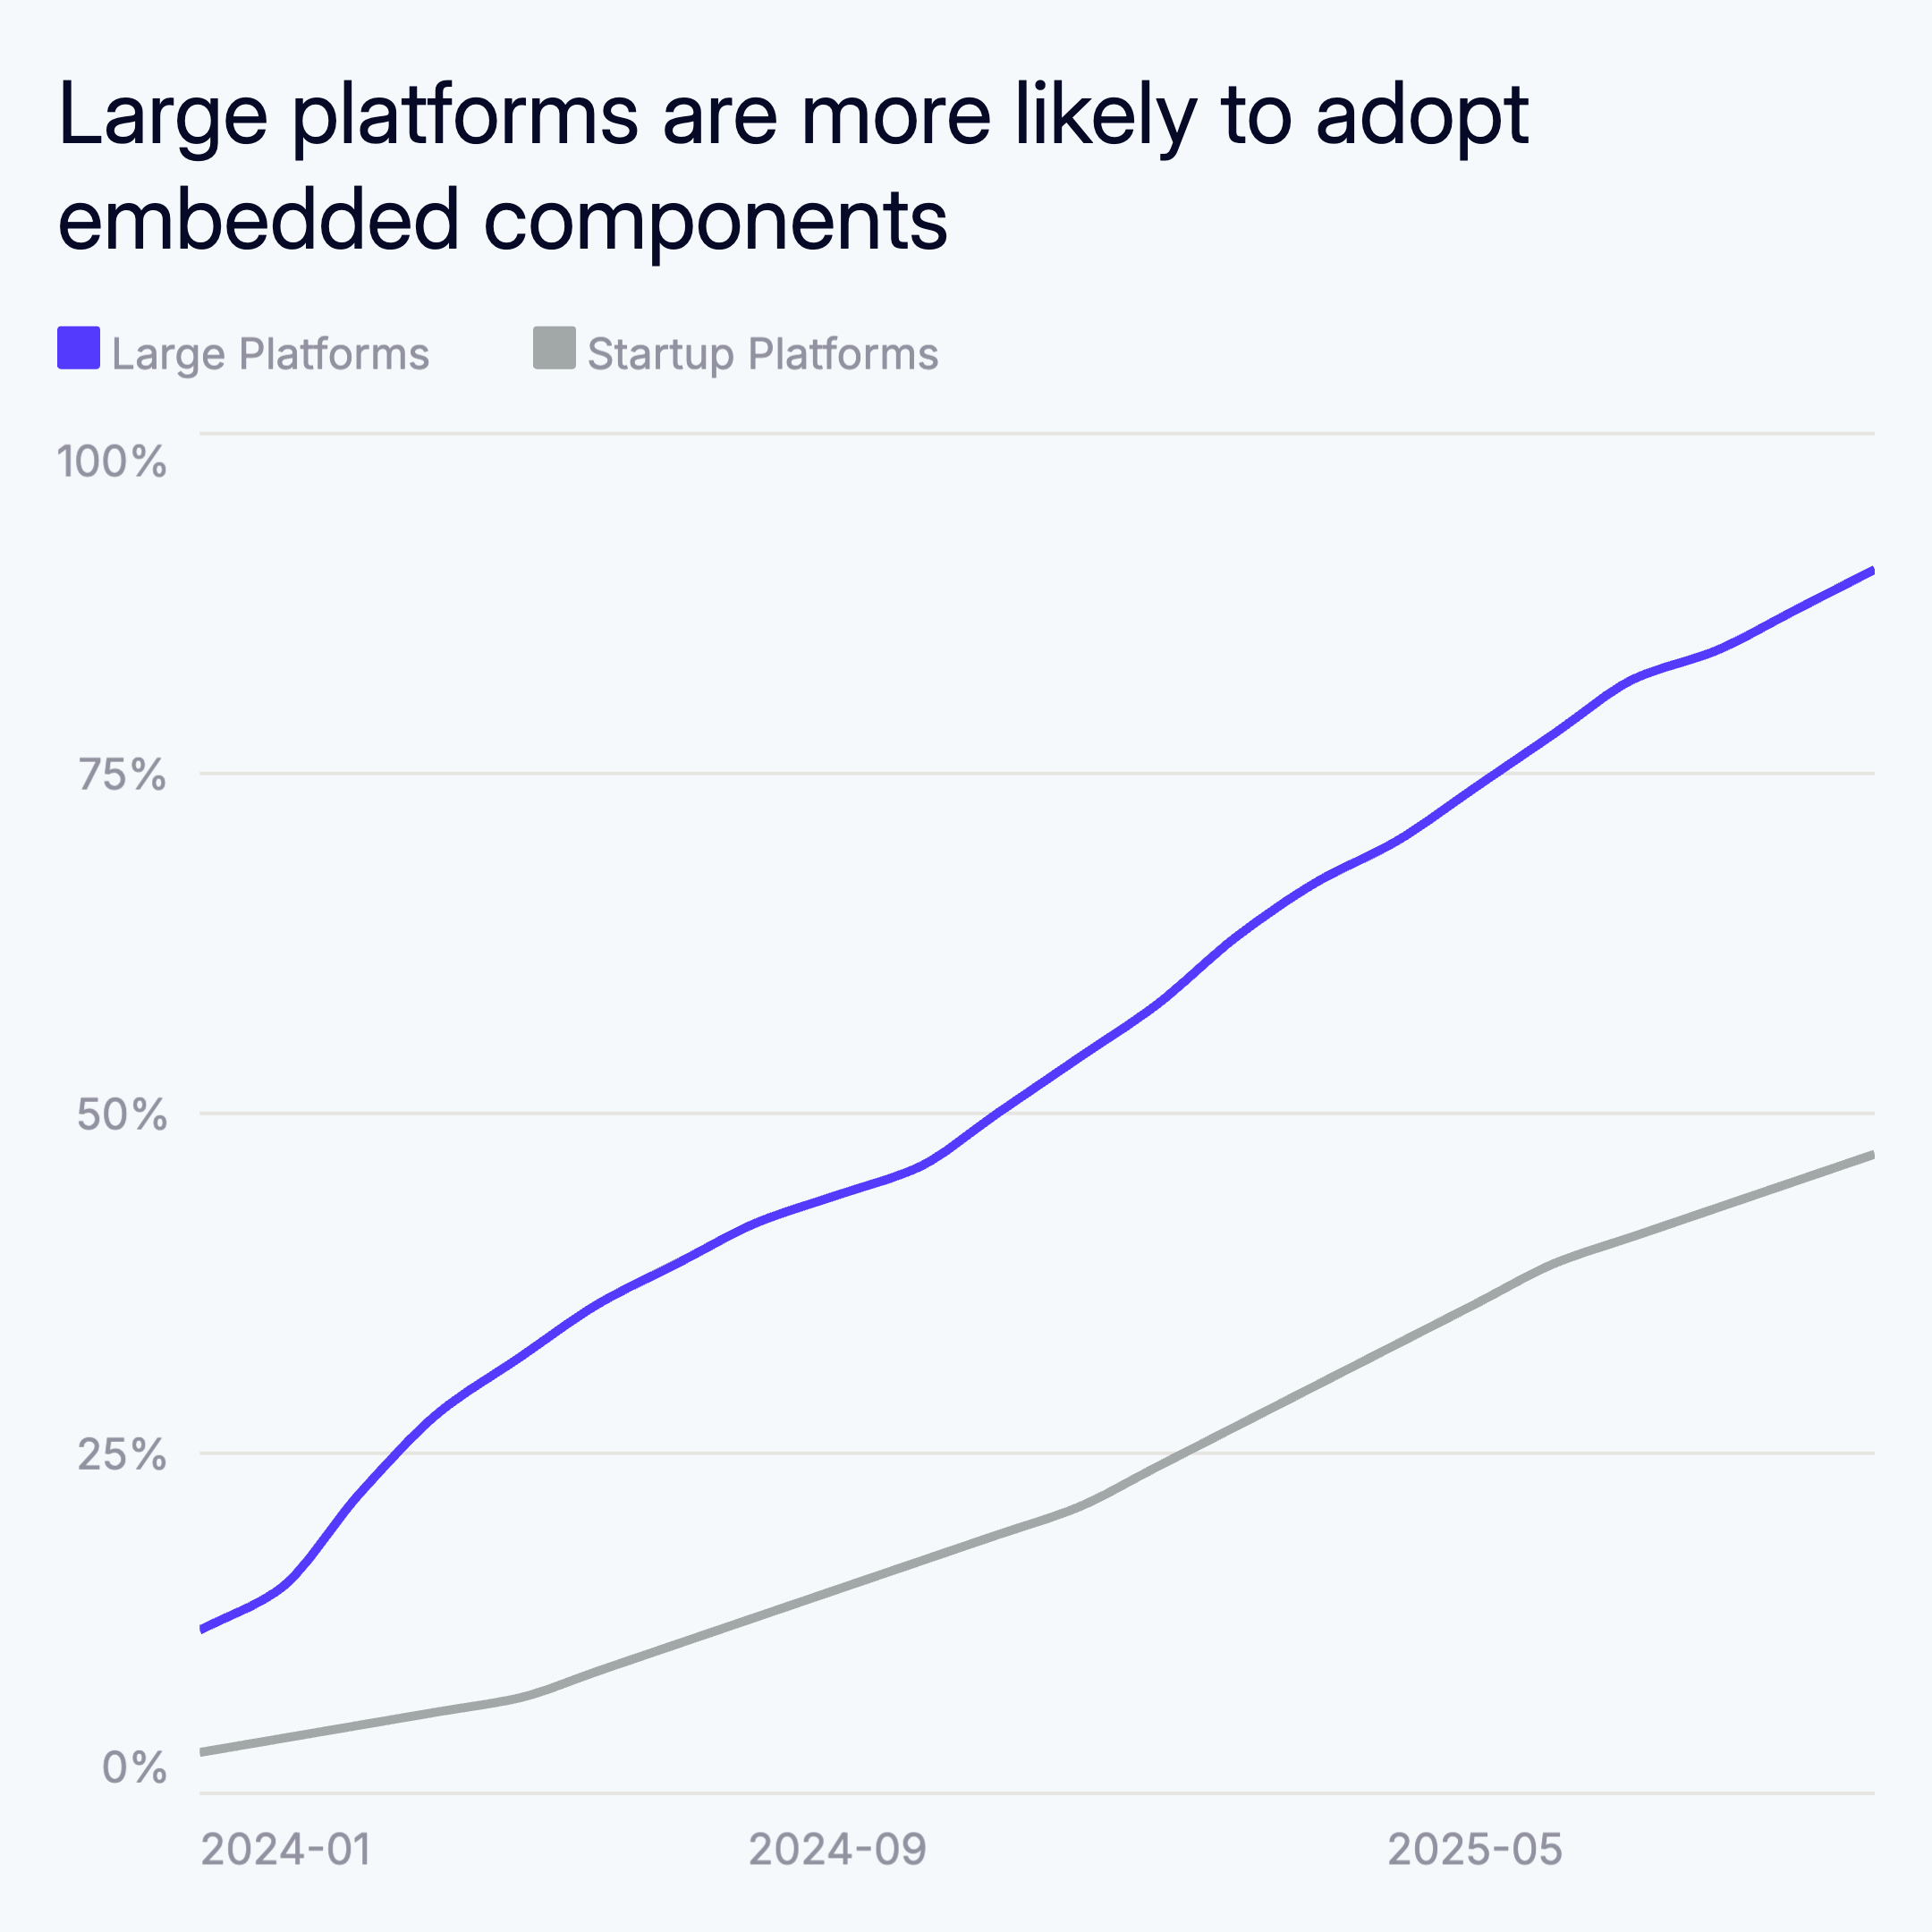
Show trends over time. A line draws across the chart, tracing revenue growth, user metrics, or any data with a time axis. Supports multiple series on the same chart.

Create Pie Chart for Free

Pie chart example

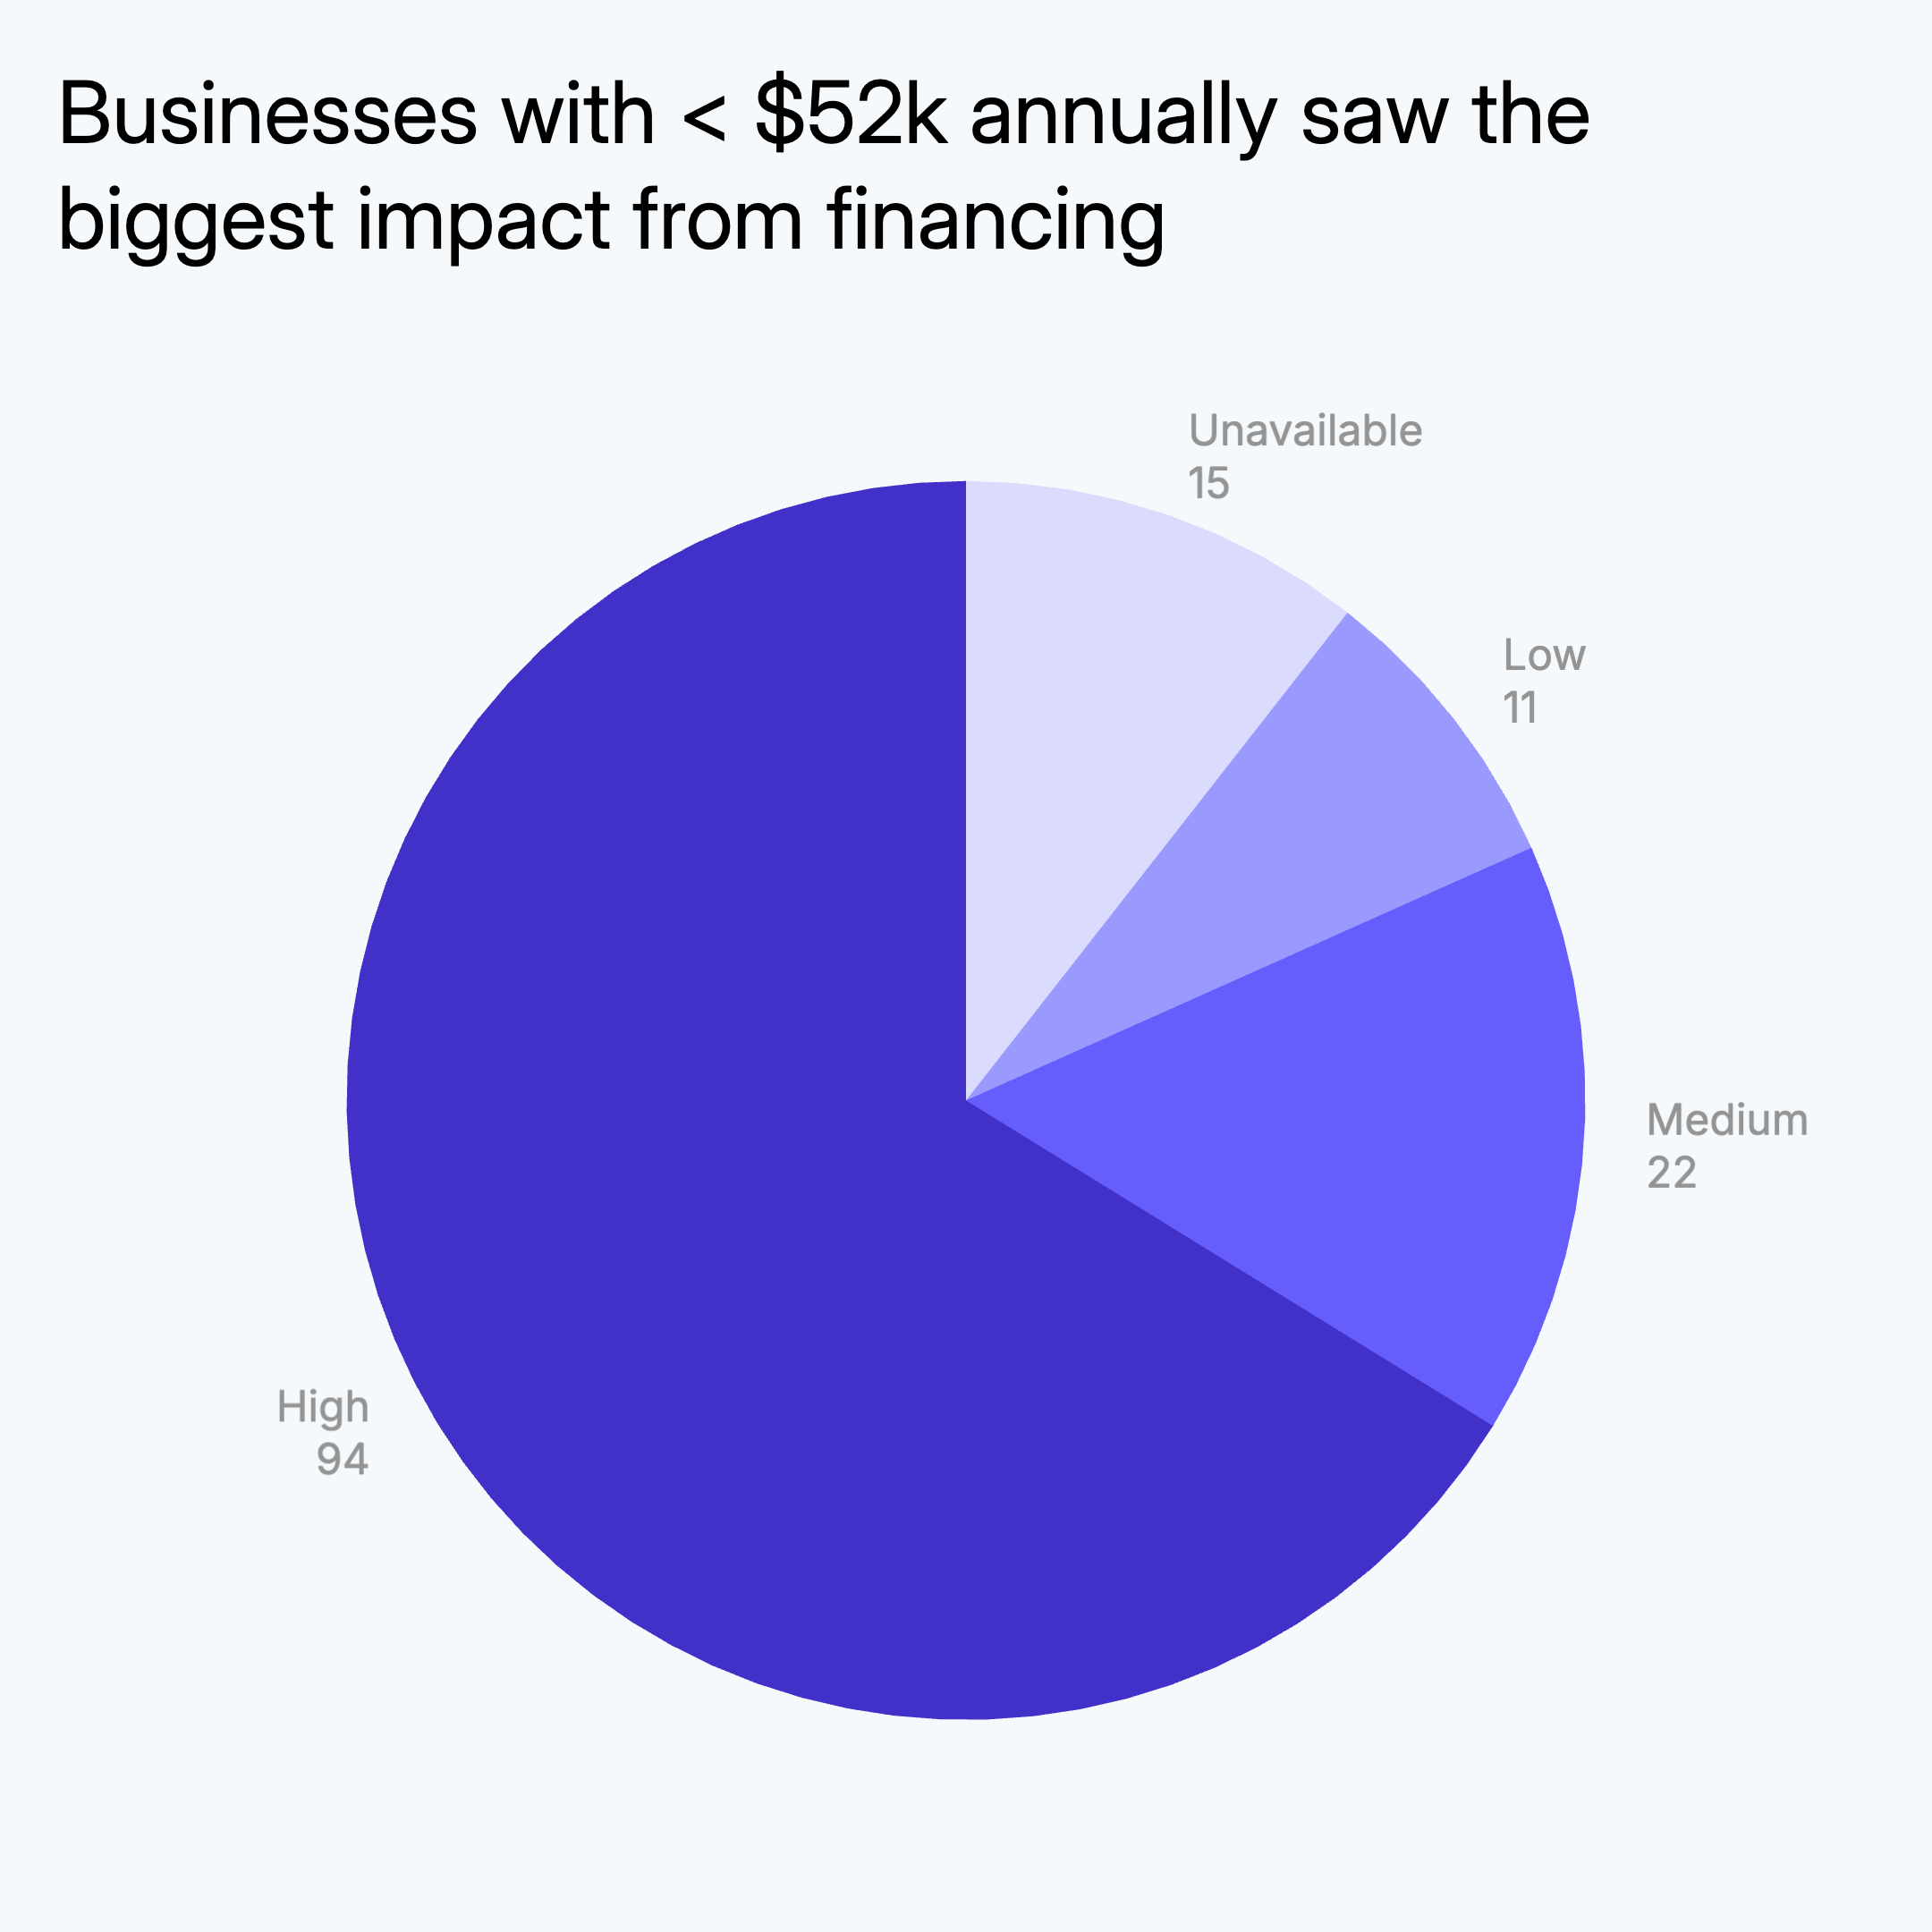
Show how parts make up a whole. Works best with 3–6 categories. Switch to a donut chart to show a label or value in the center.

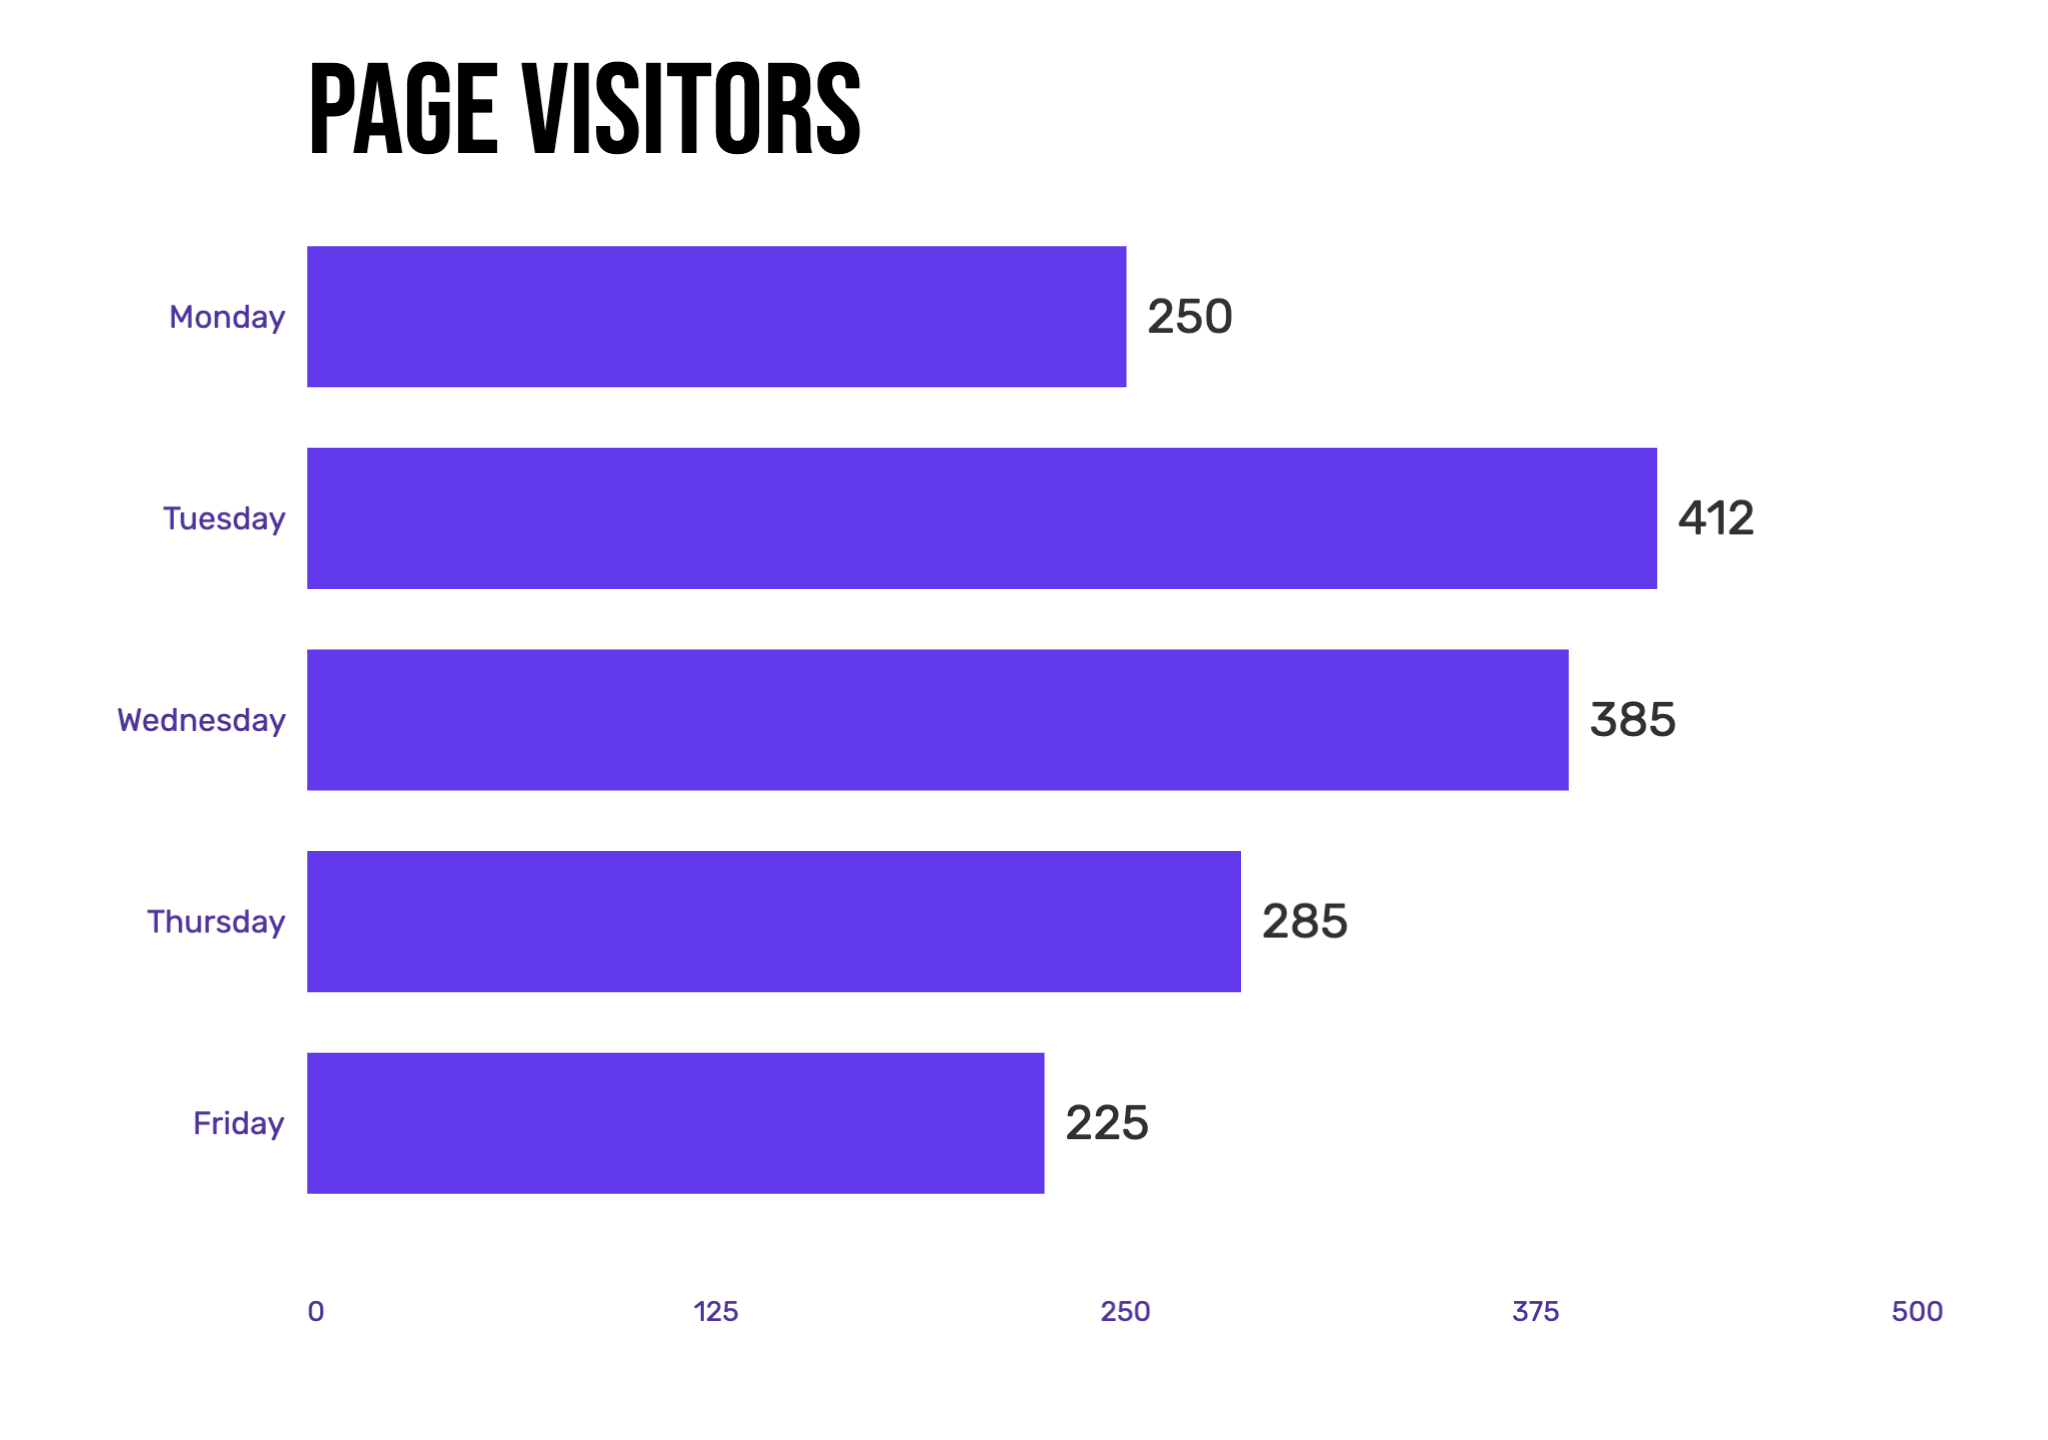
Create Horizontal Bar Chart for Free

Horizontal bar chart example

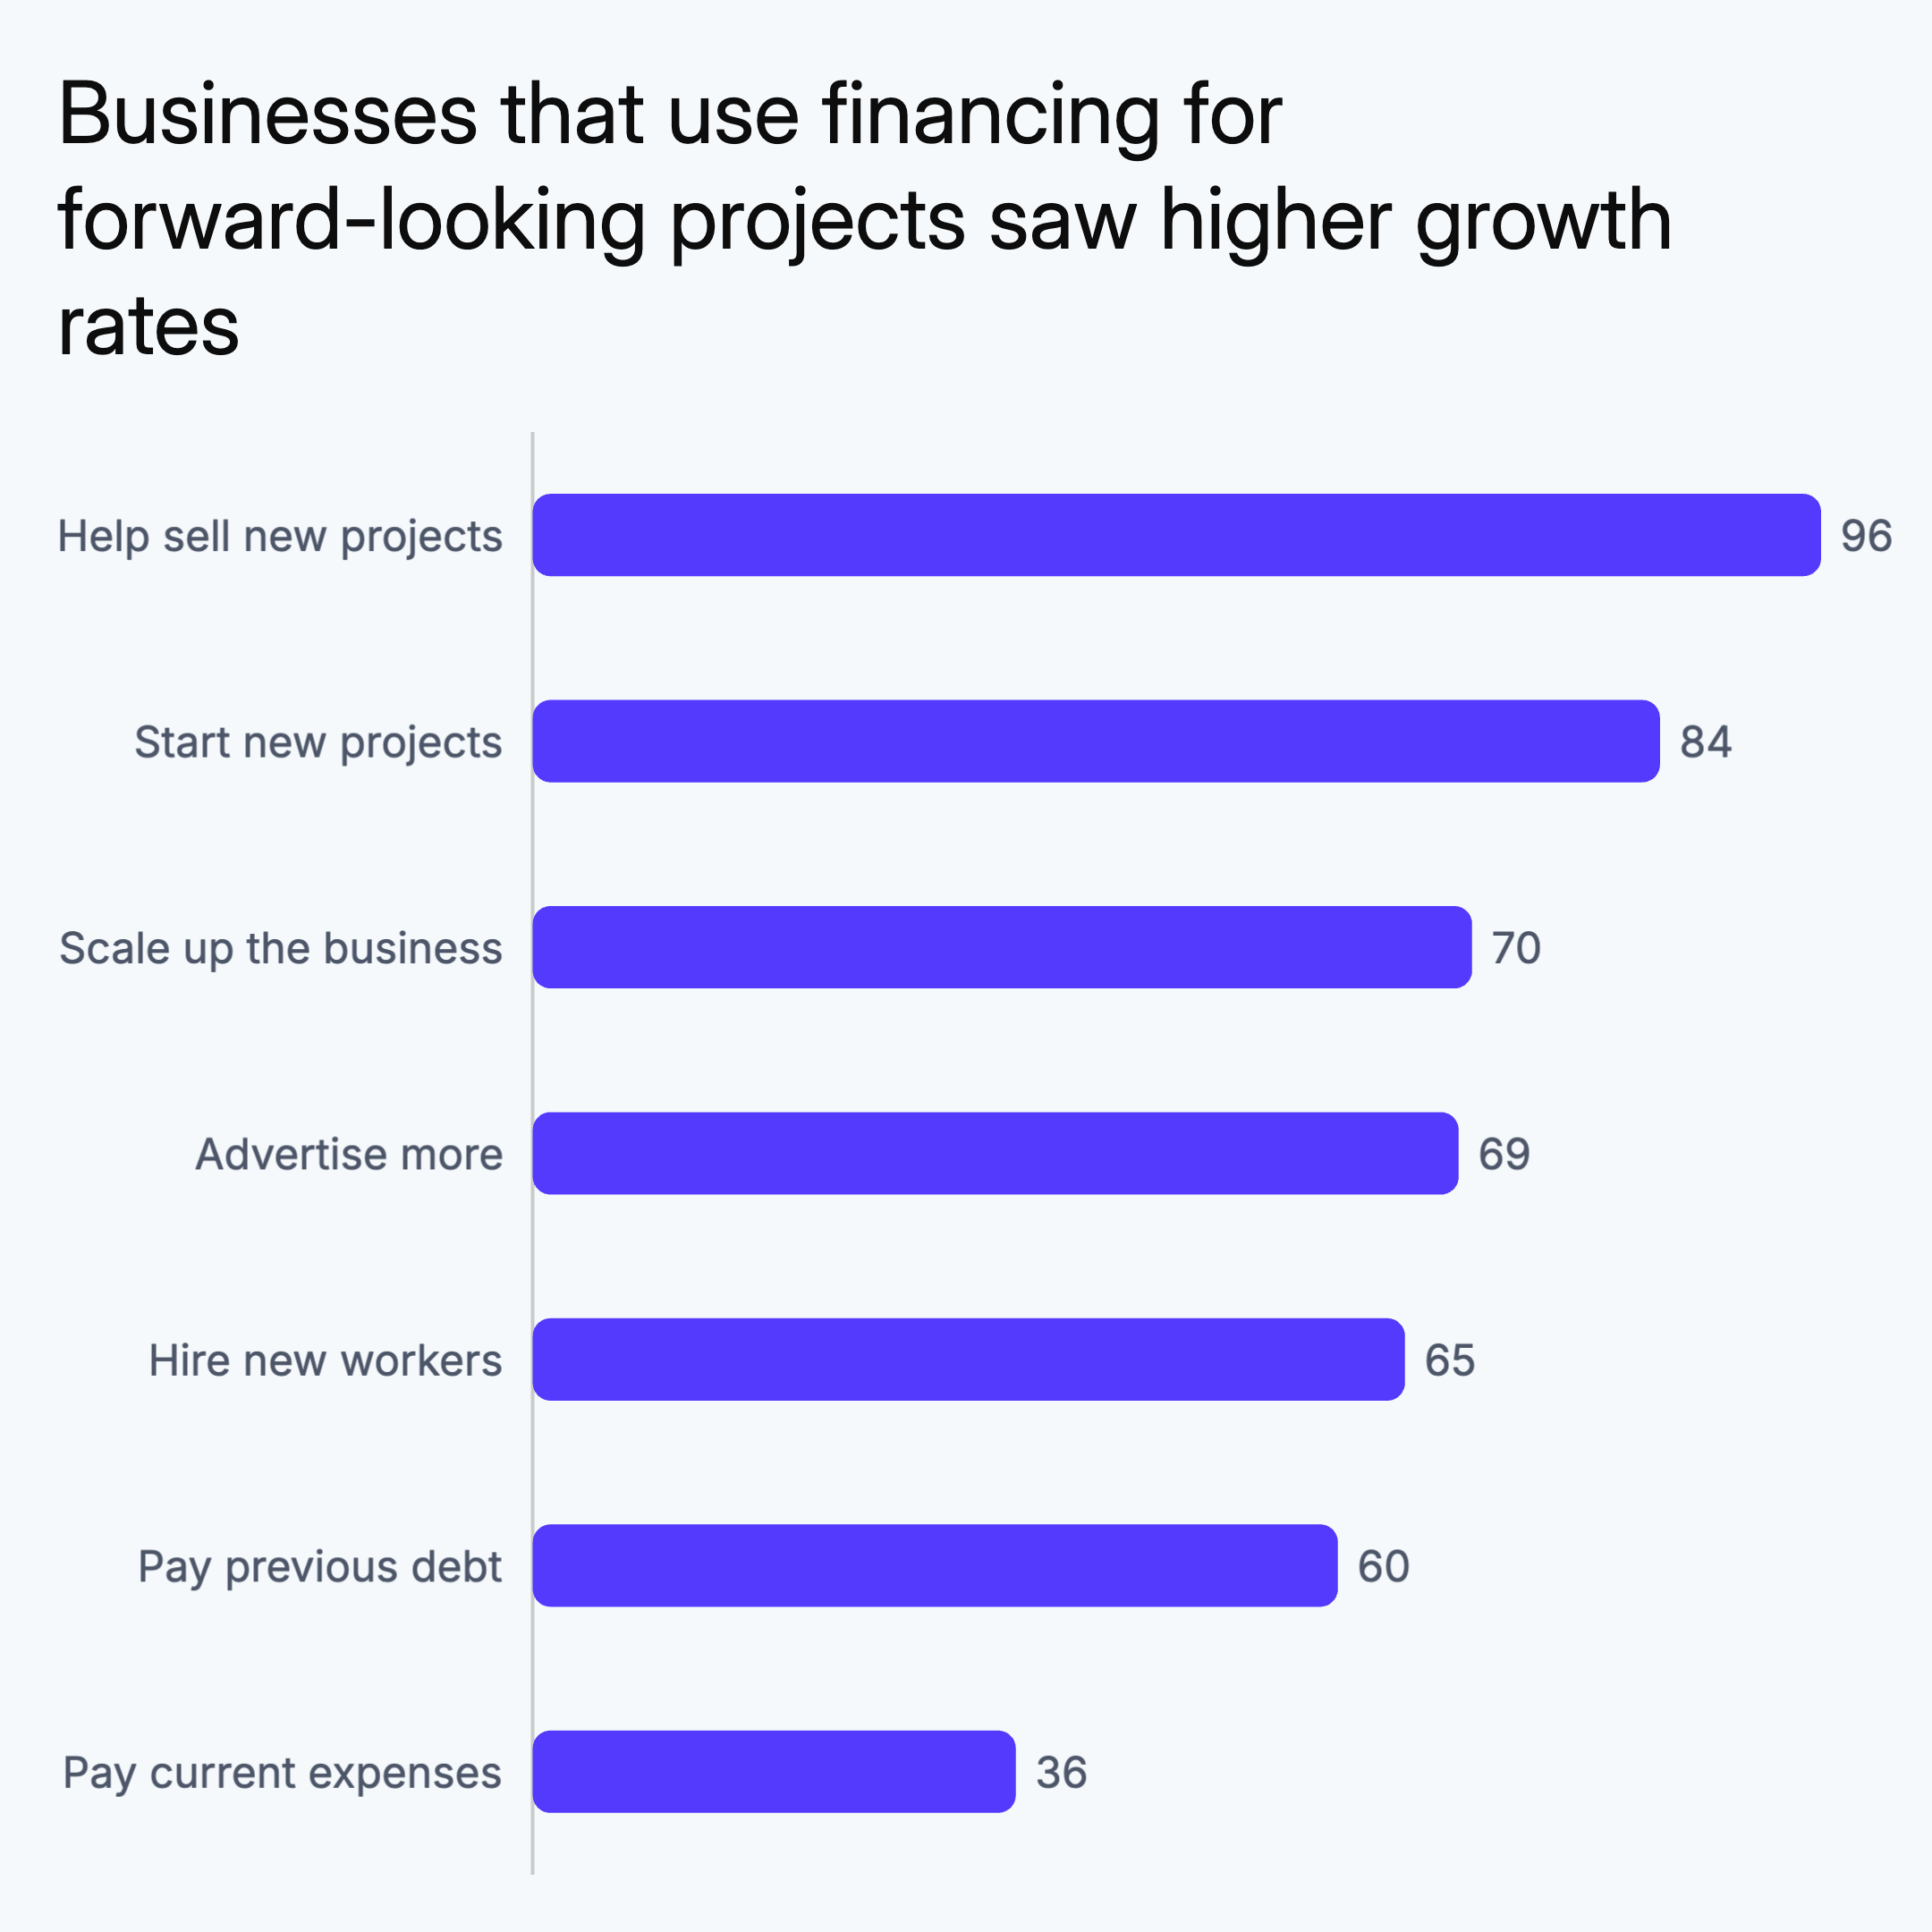
Bars extend left to right — better when category names are long or when comparing many items where vertical columns would be cramped.

Create Scatter Plot for Free

Scatter plot example

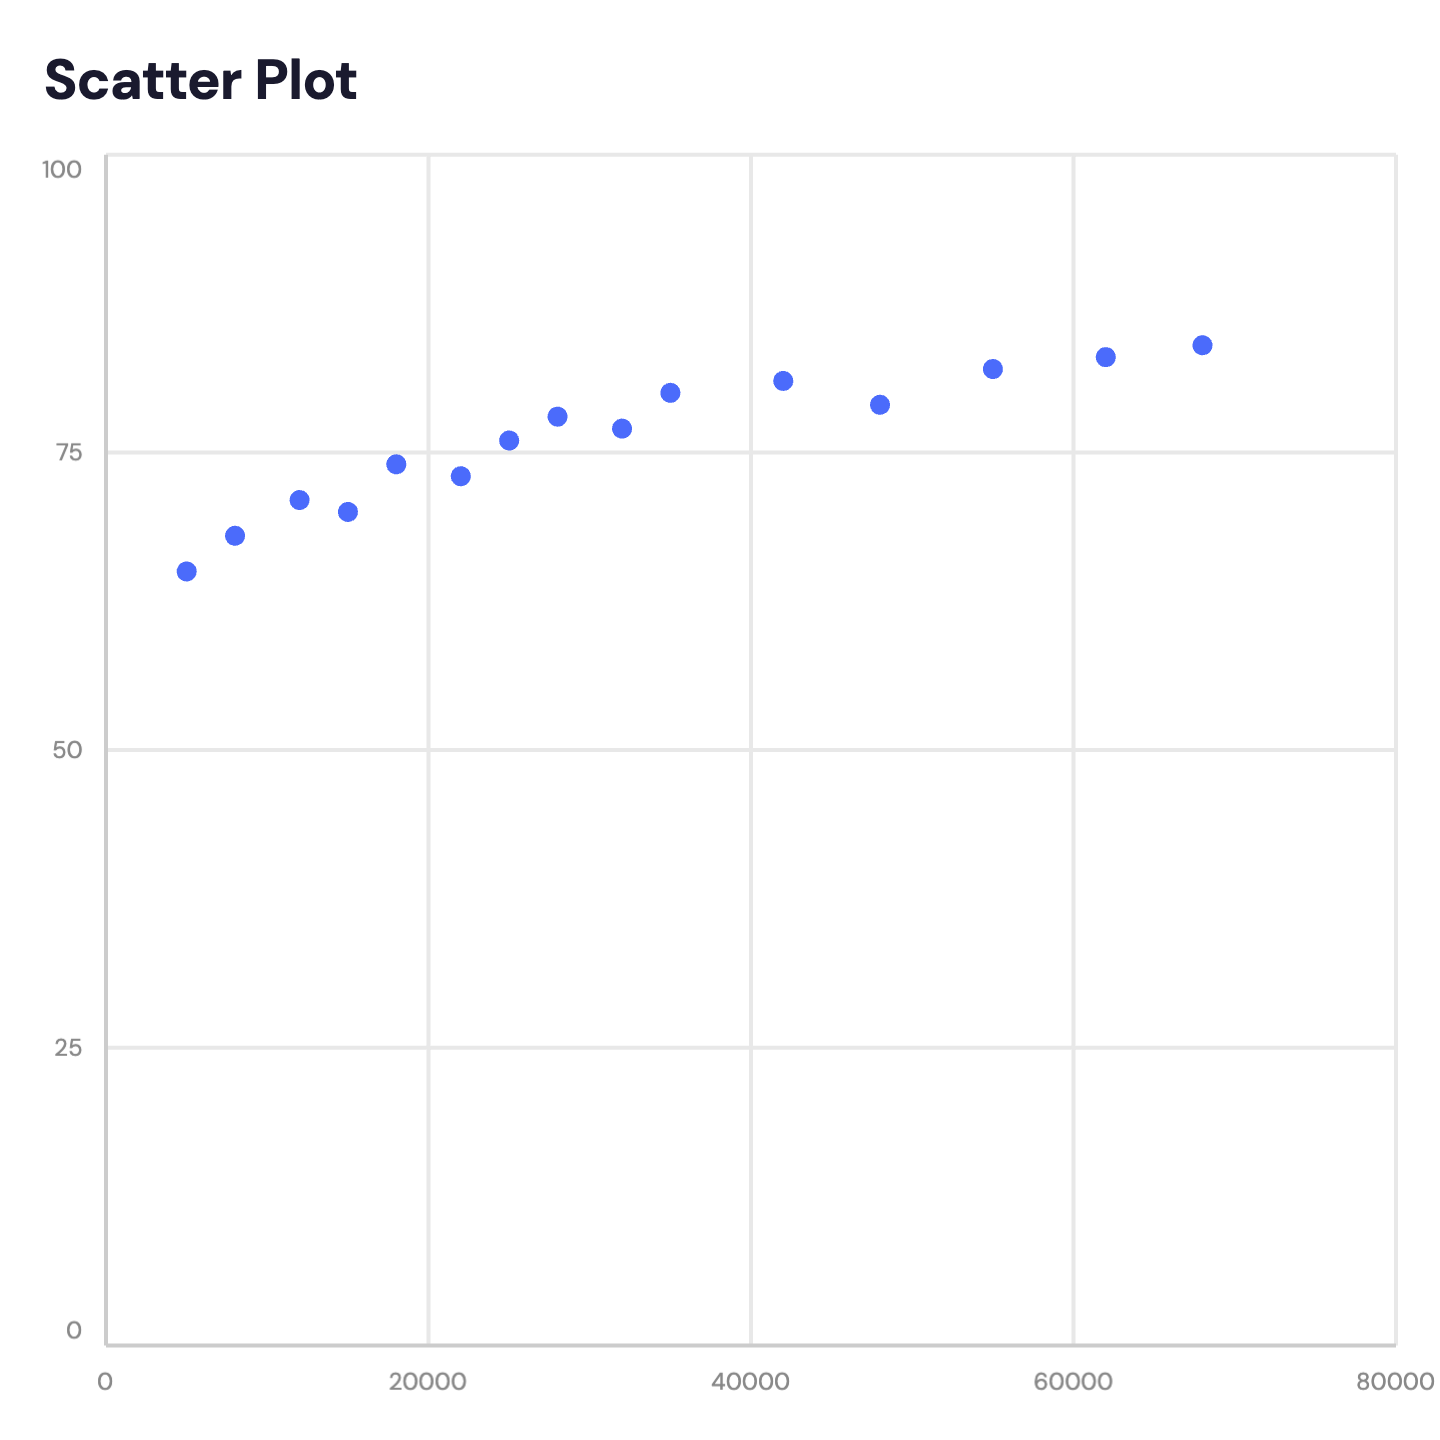
Plot data points on X/Y axes to reveal correlations, clusters, and outliers. Add a label column to identify individual points.

Create Waterfall Chart for Free

Waterfall chart example

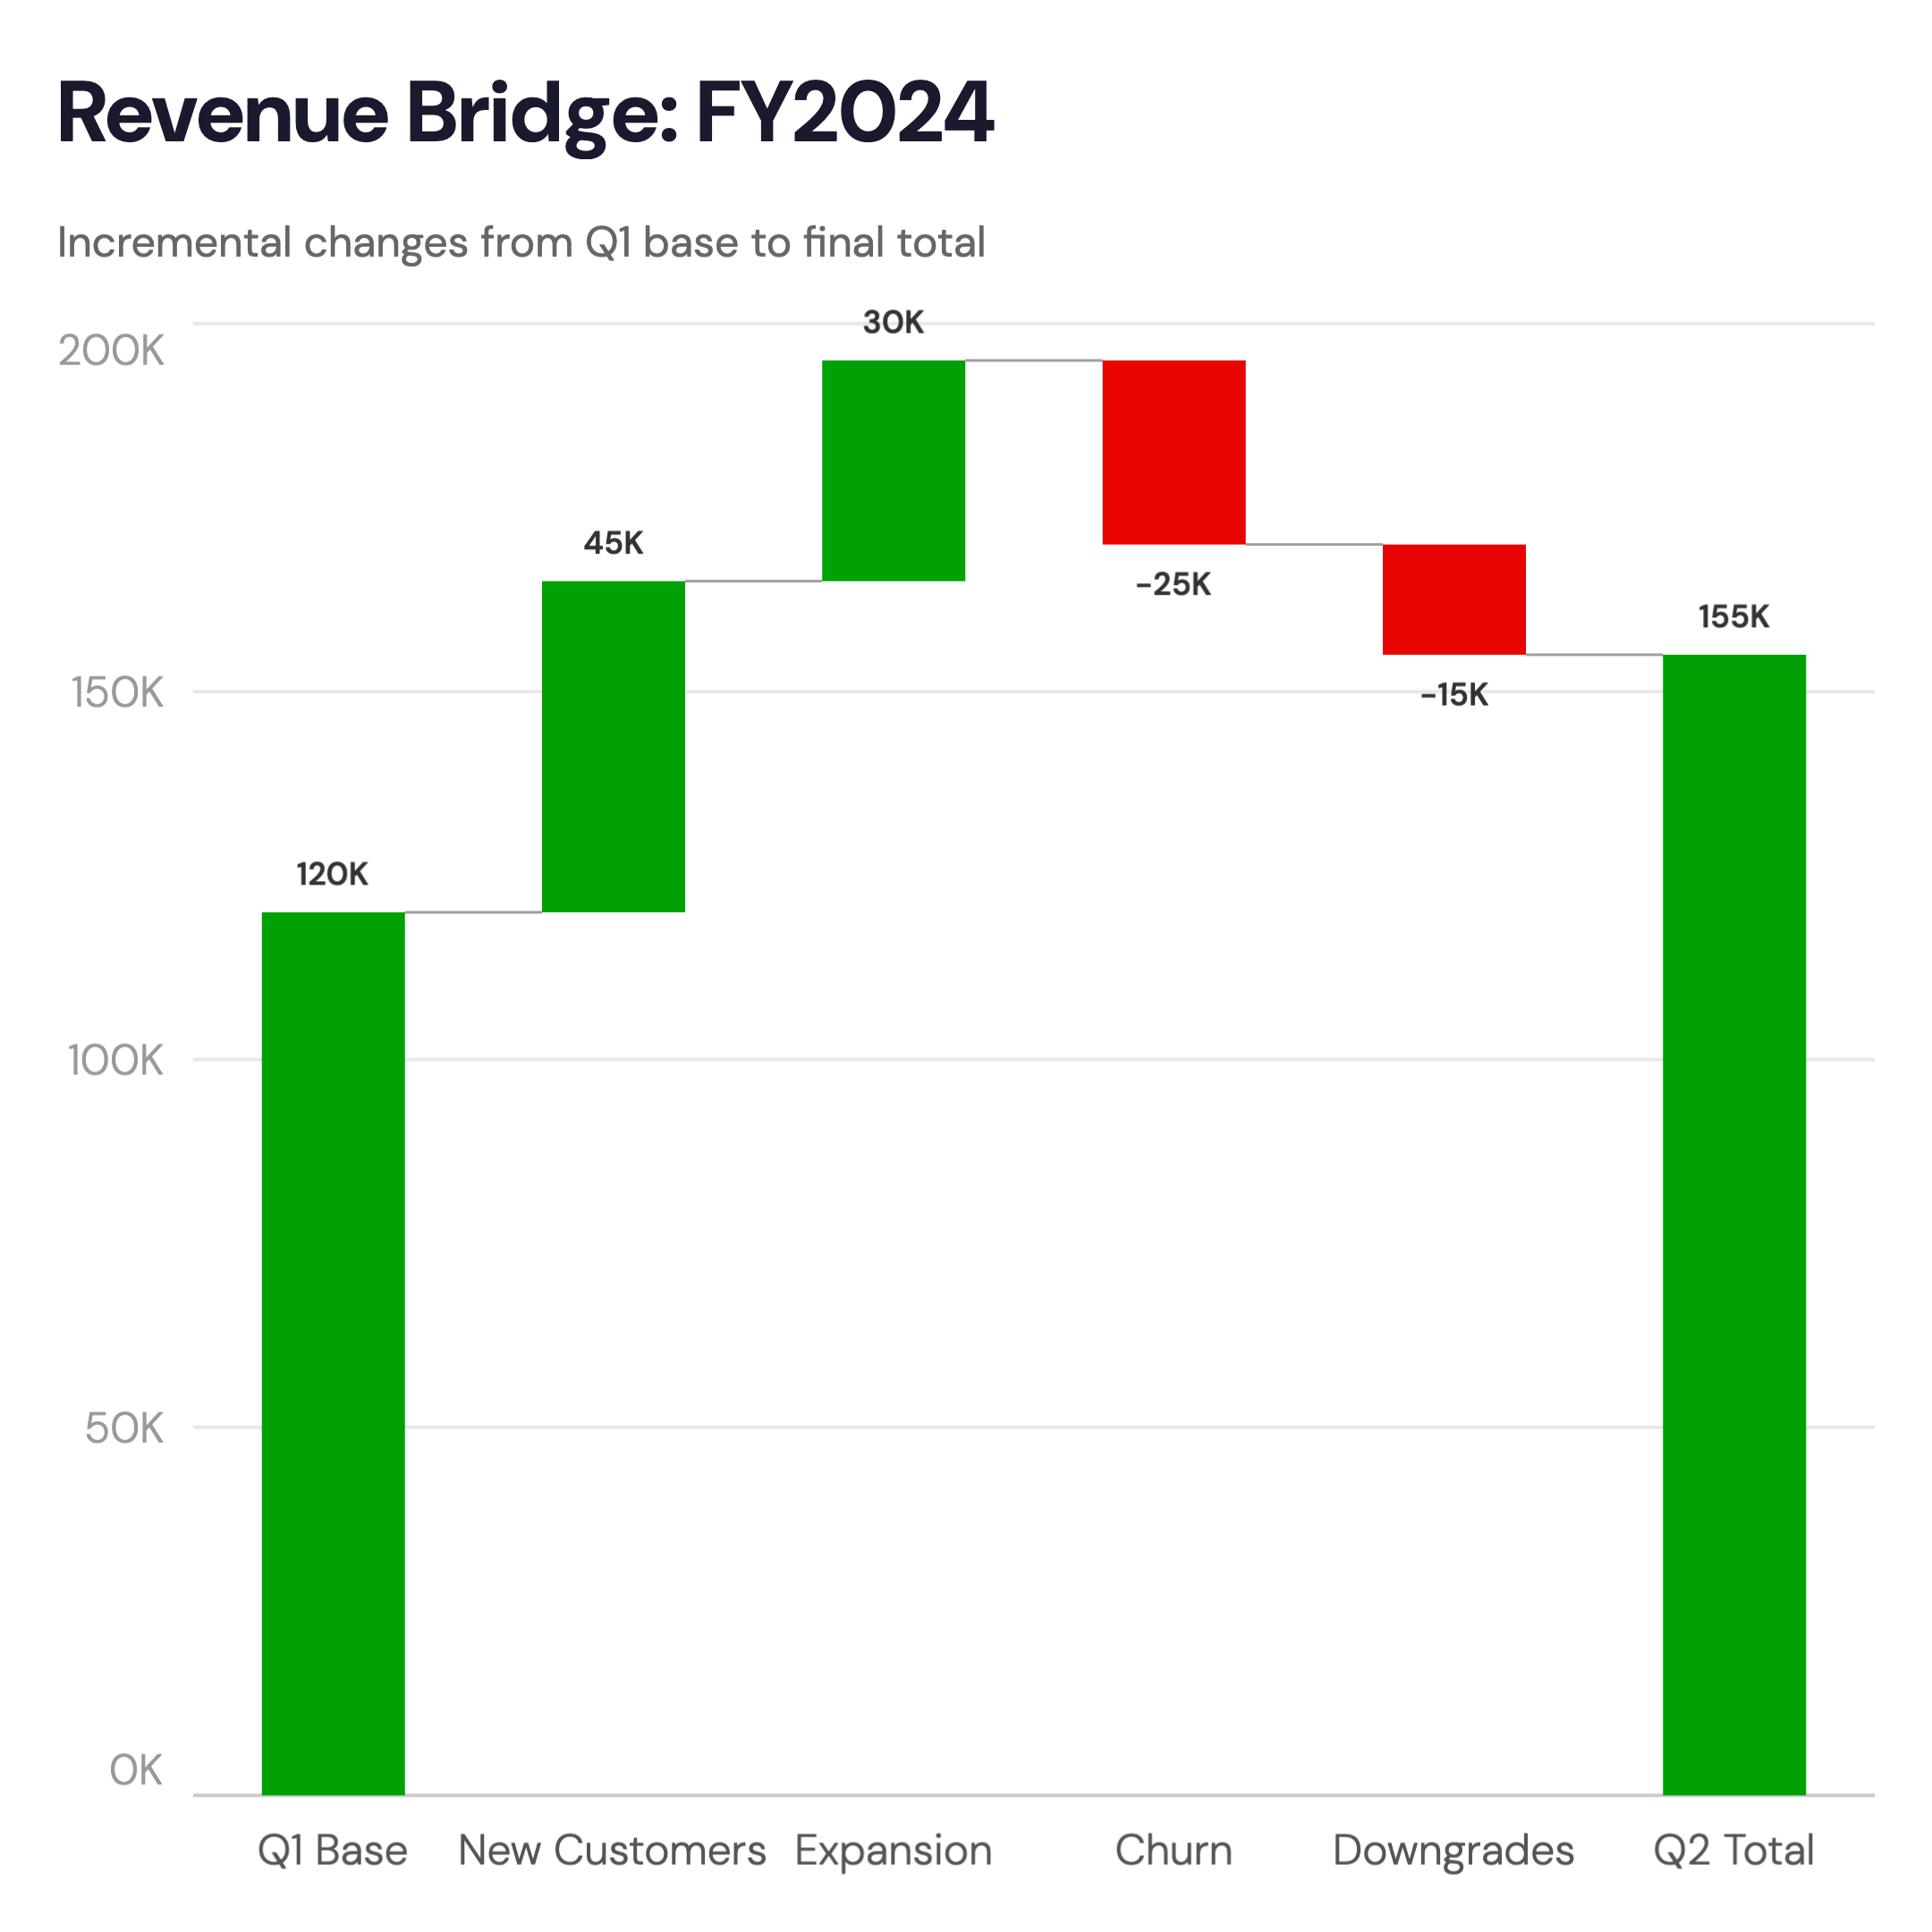
Show how a starting value grows or shrinks through a series of positive and negative changes to reach a final total. Common for P&L, budget variance, and bridge charts.

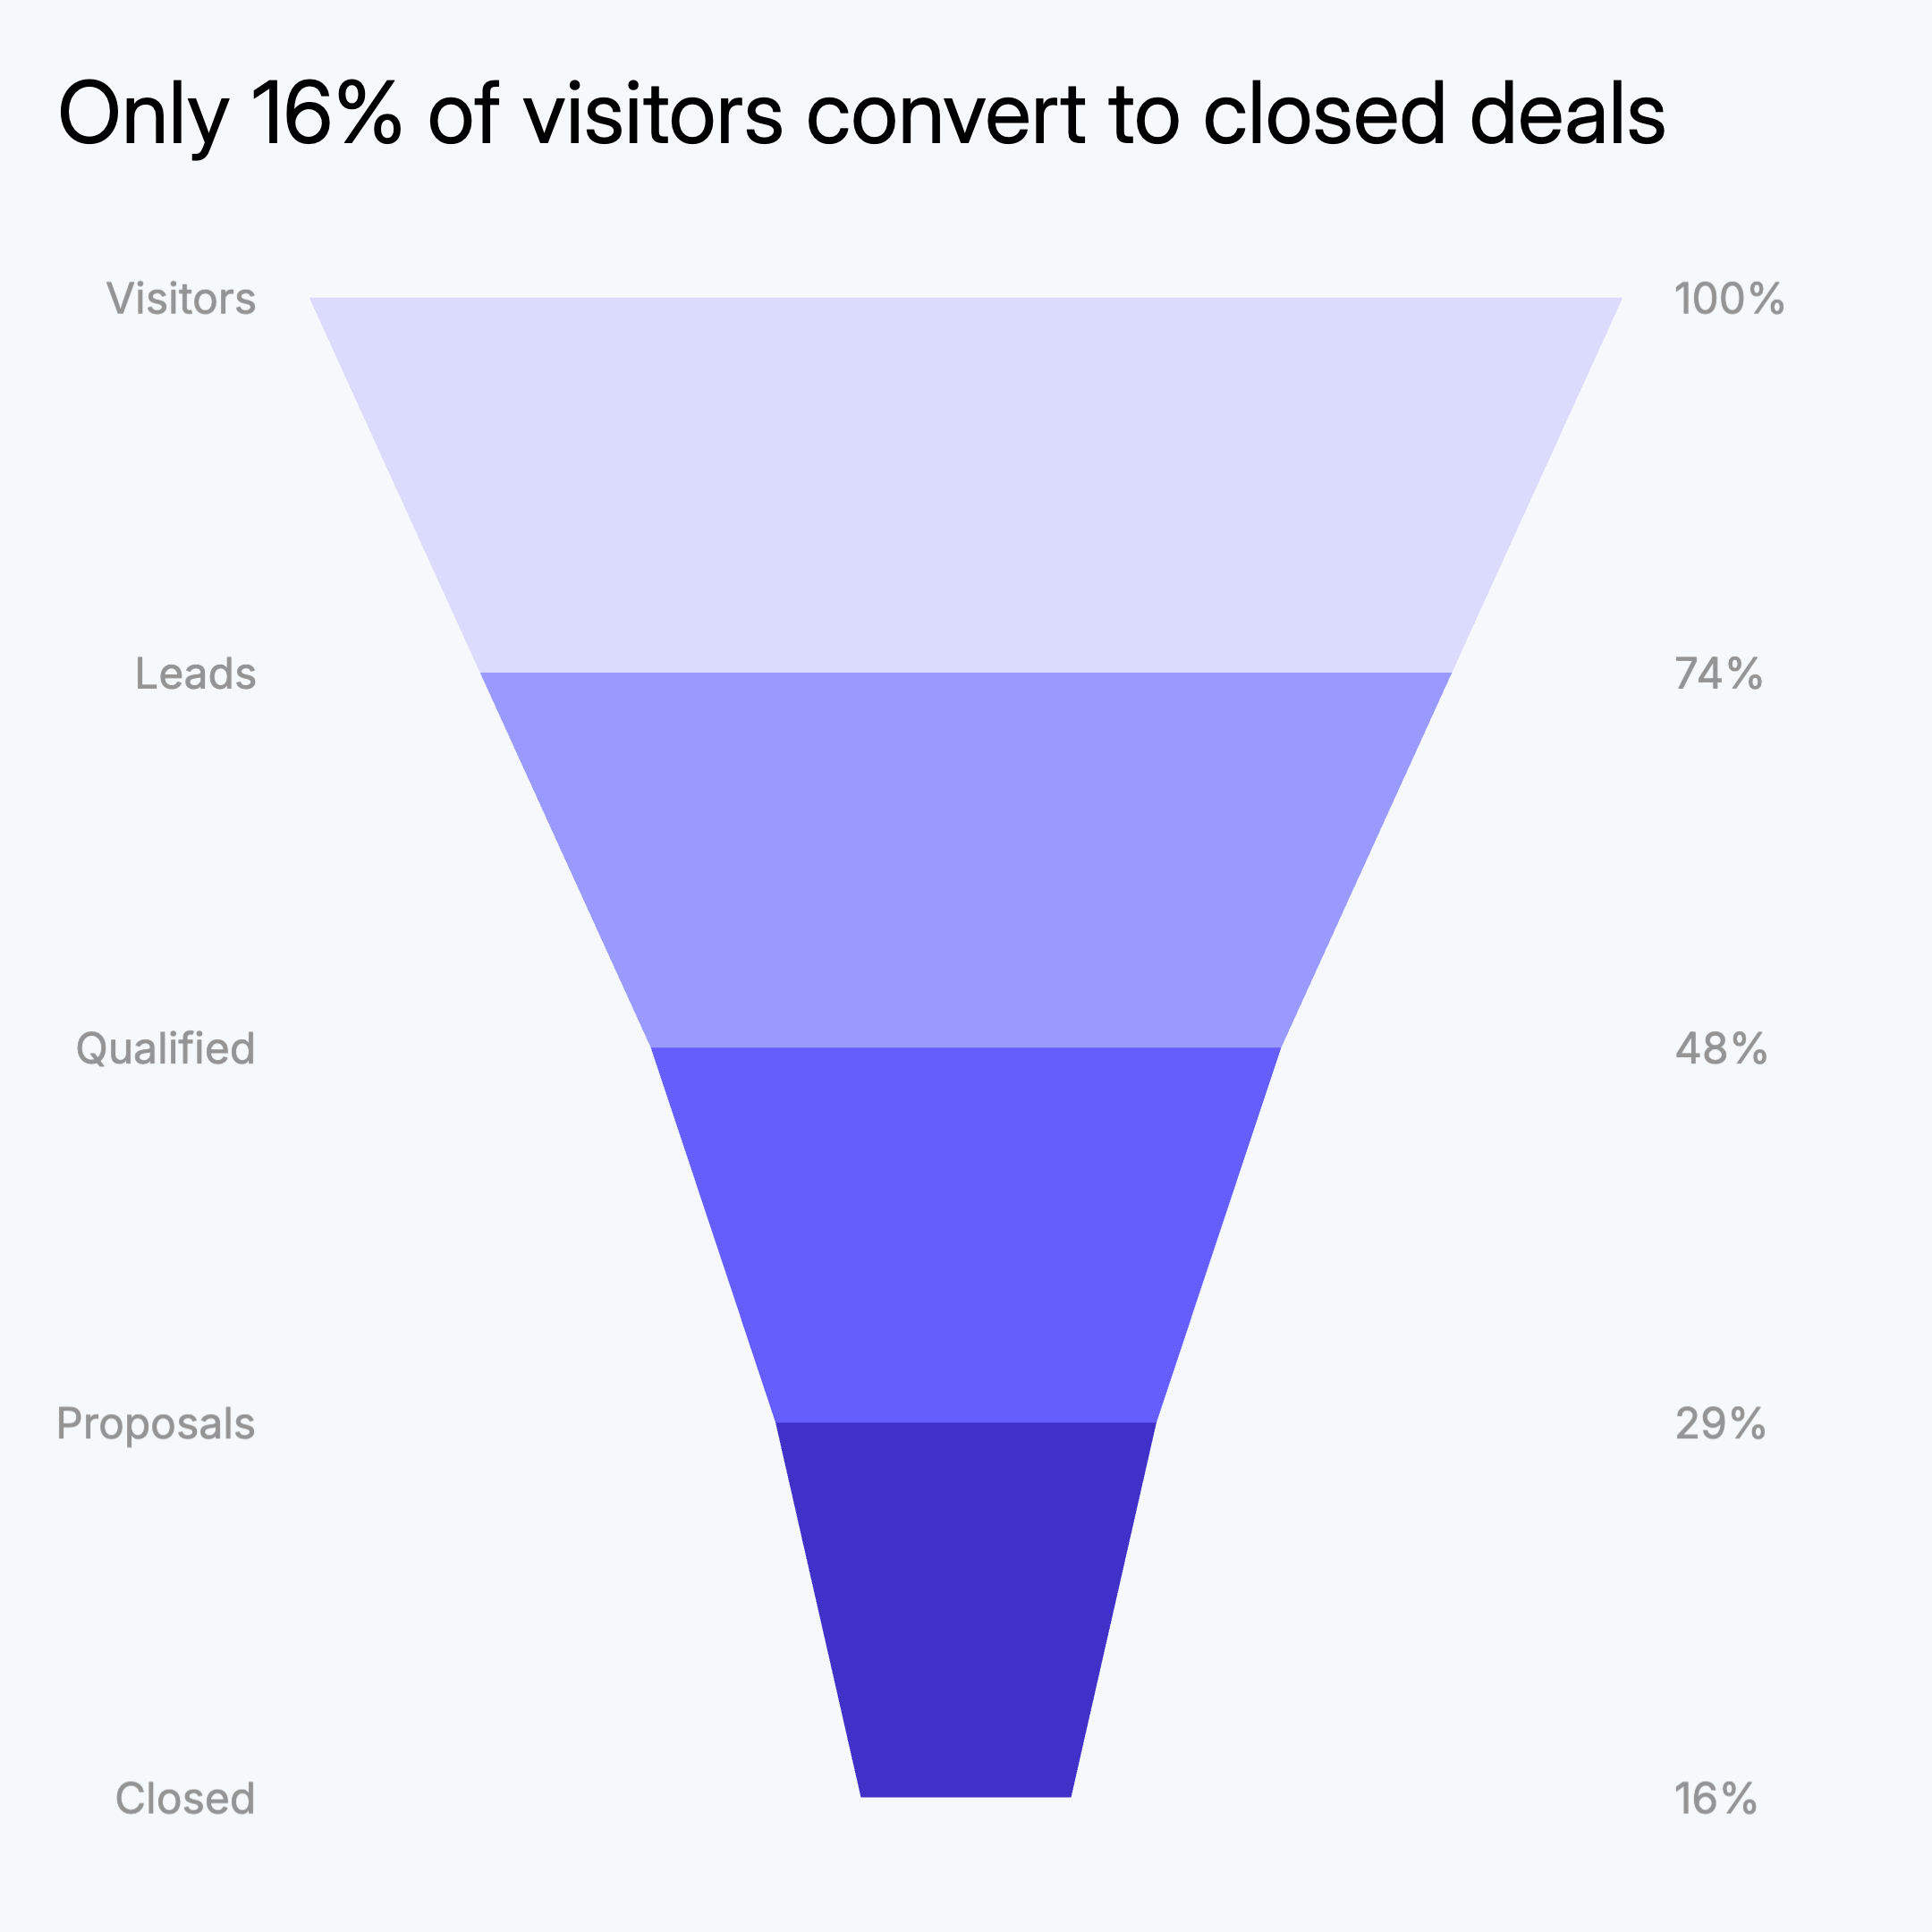
Create Funnel Chart for Free

Funnel chart example

Visualize drop-off across sequential stages — sales pipelines, conversion funnels, hiring flows. Each bar shows how many remain at each stage.

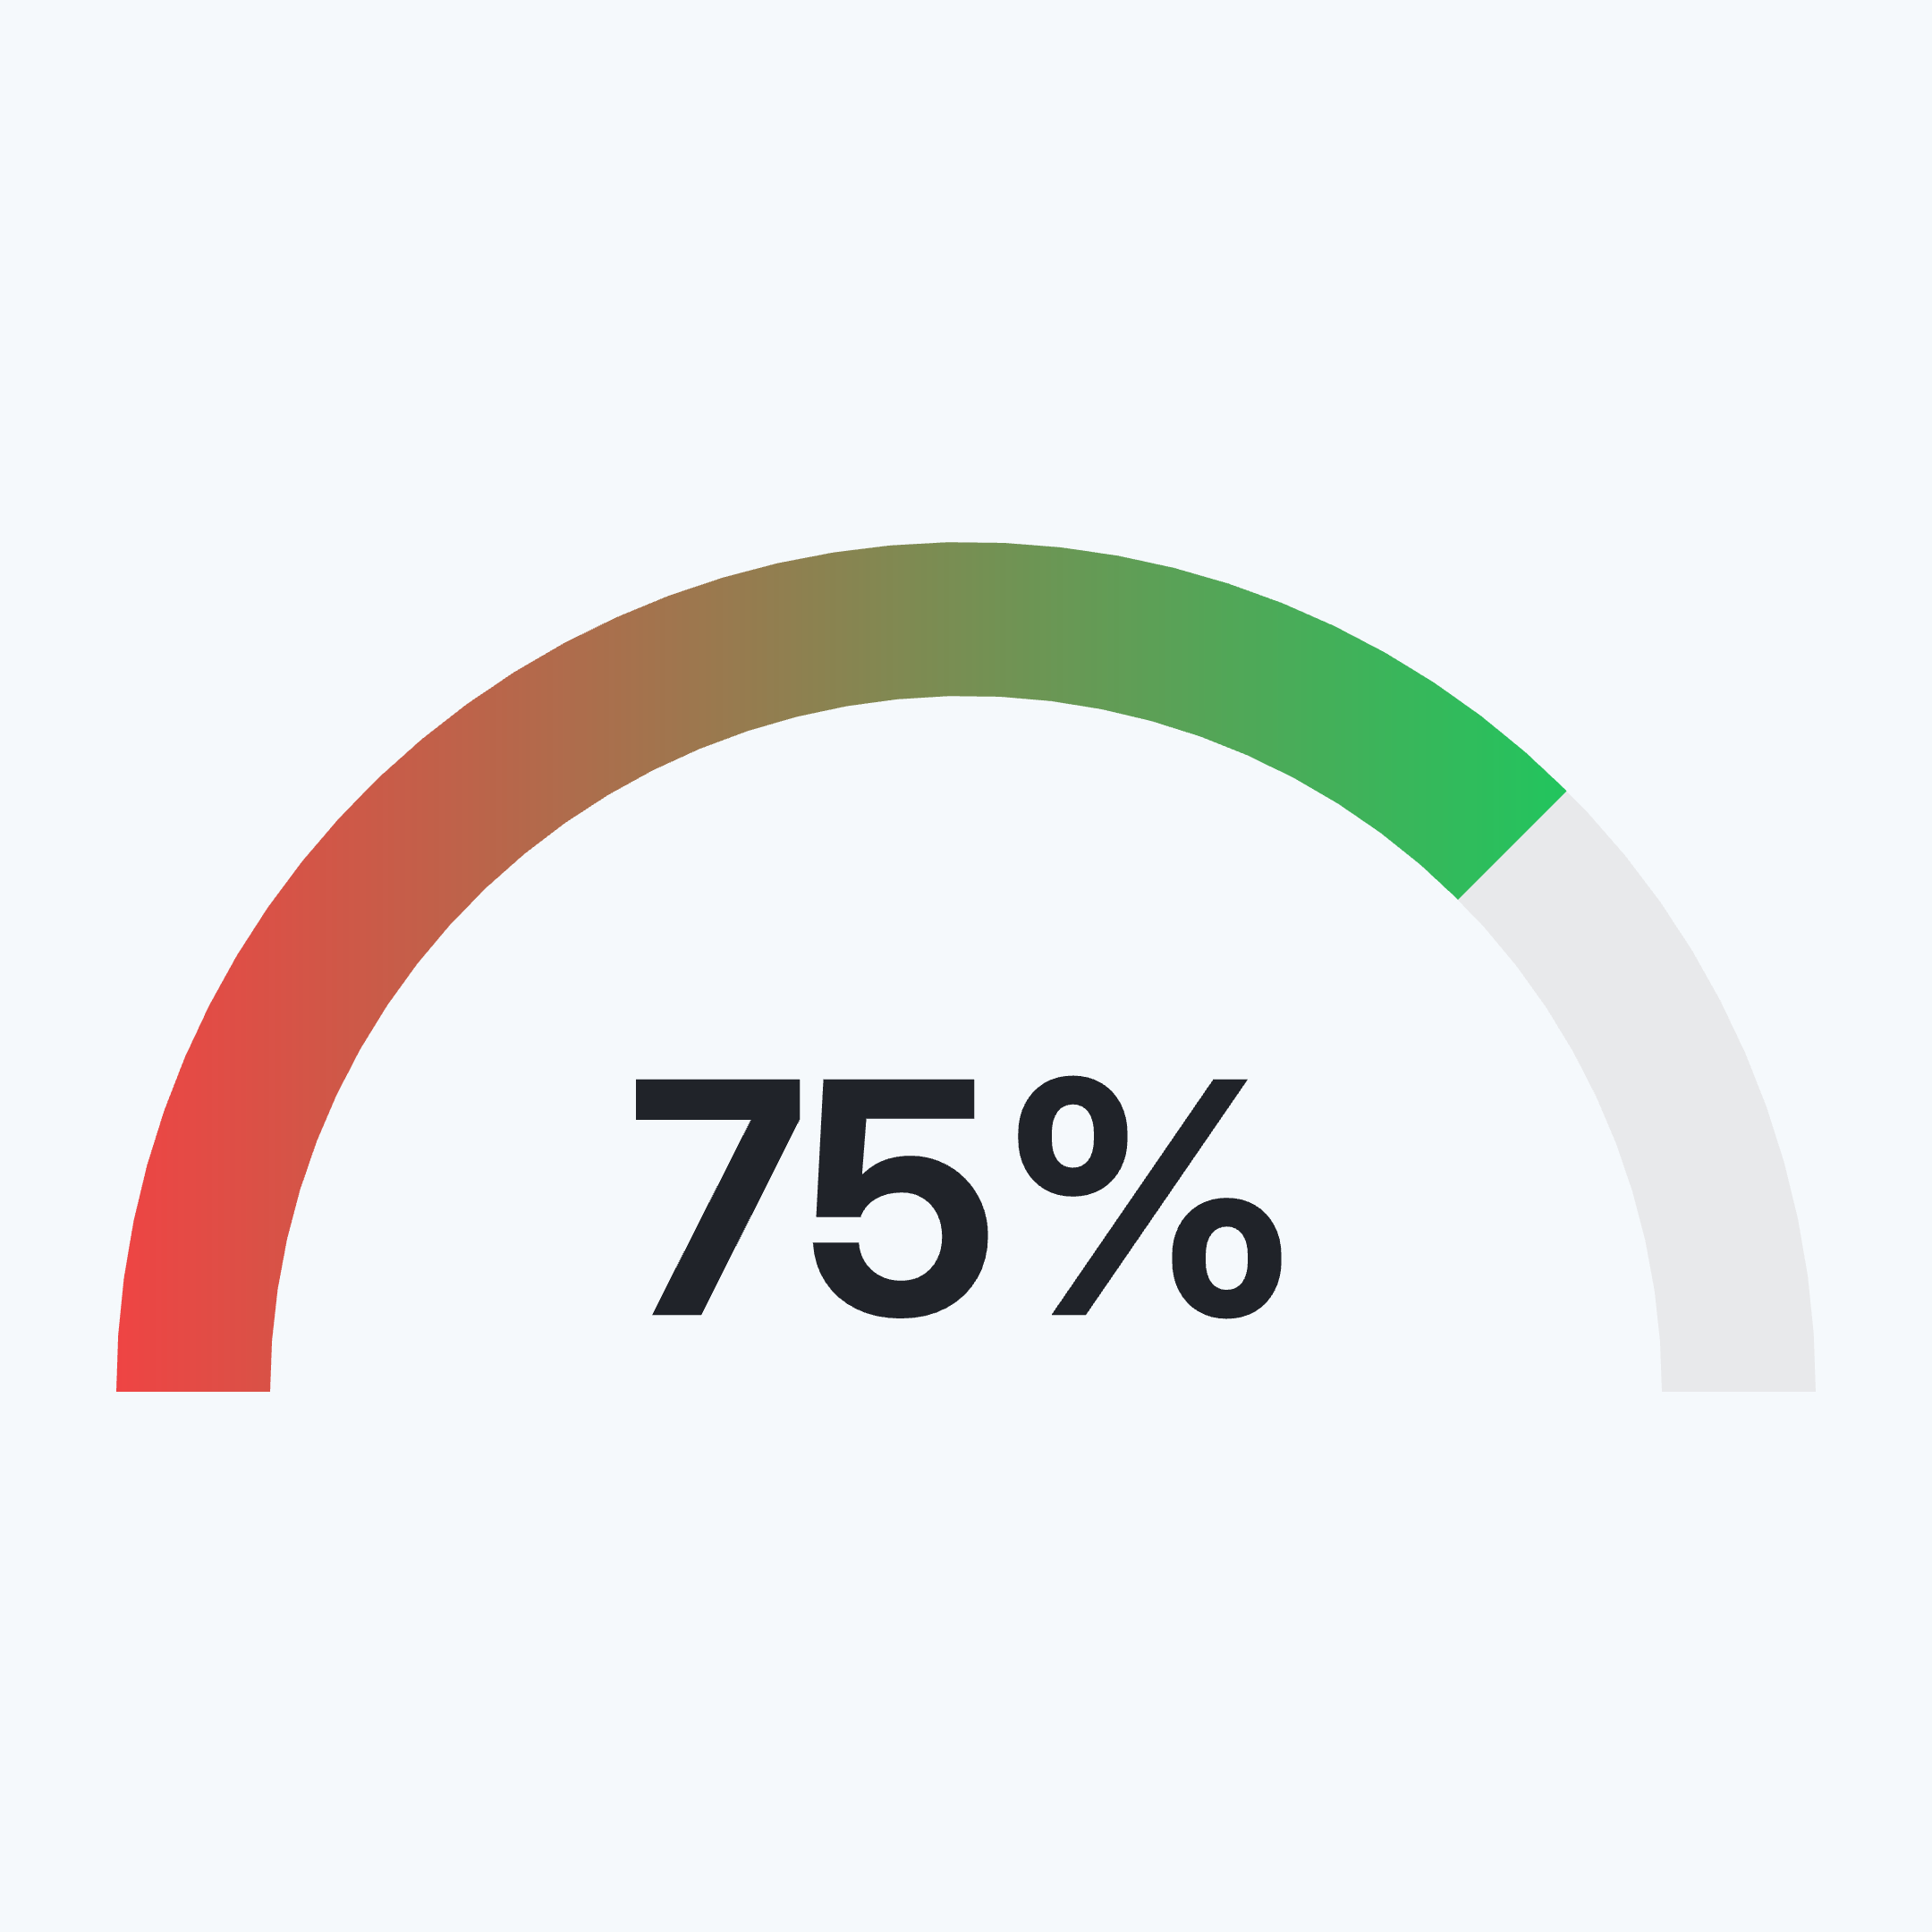
Create Gauge Chart for Free

Gauge chart example

Show progress toward a target with animated activity rings — KPIs, goal attainment, sales quotas. Stack multiple rings to show several metrics at once.

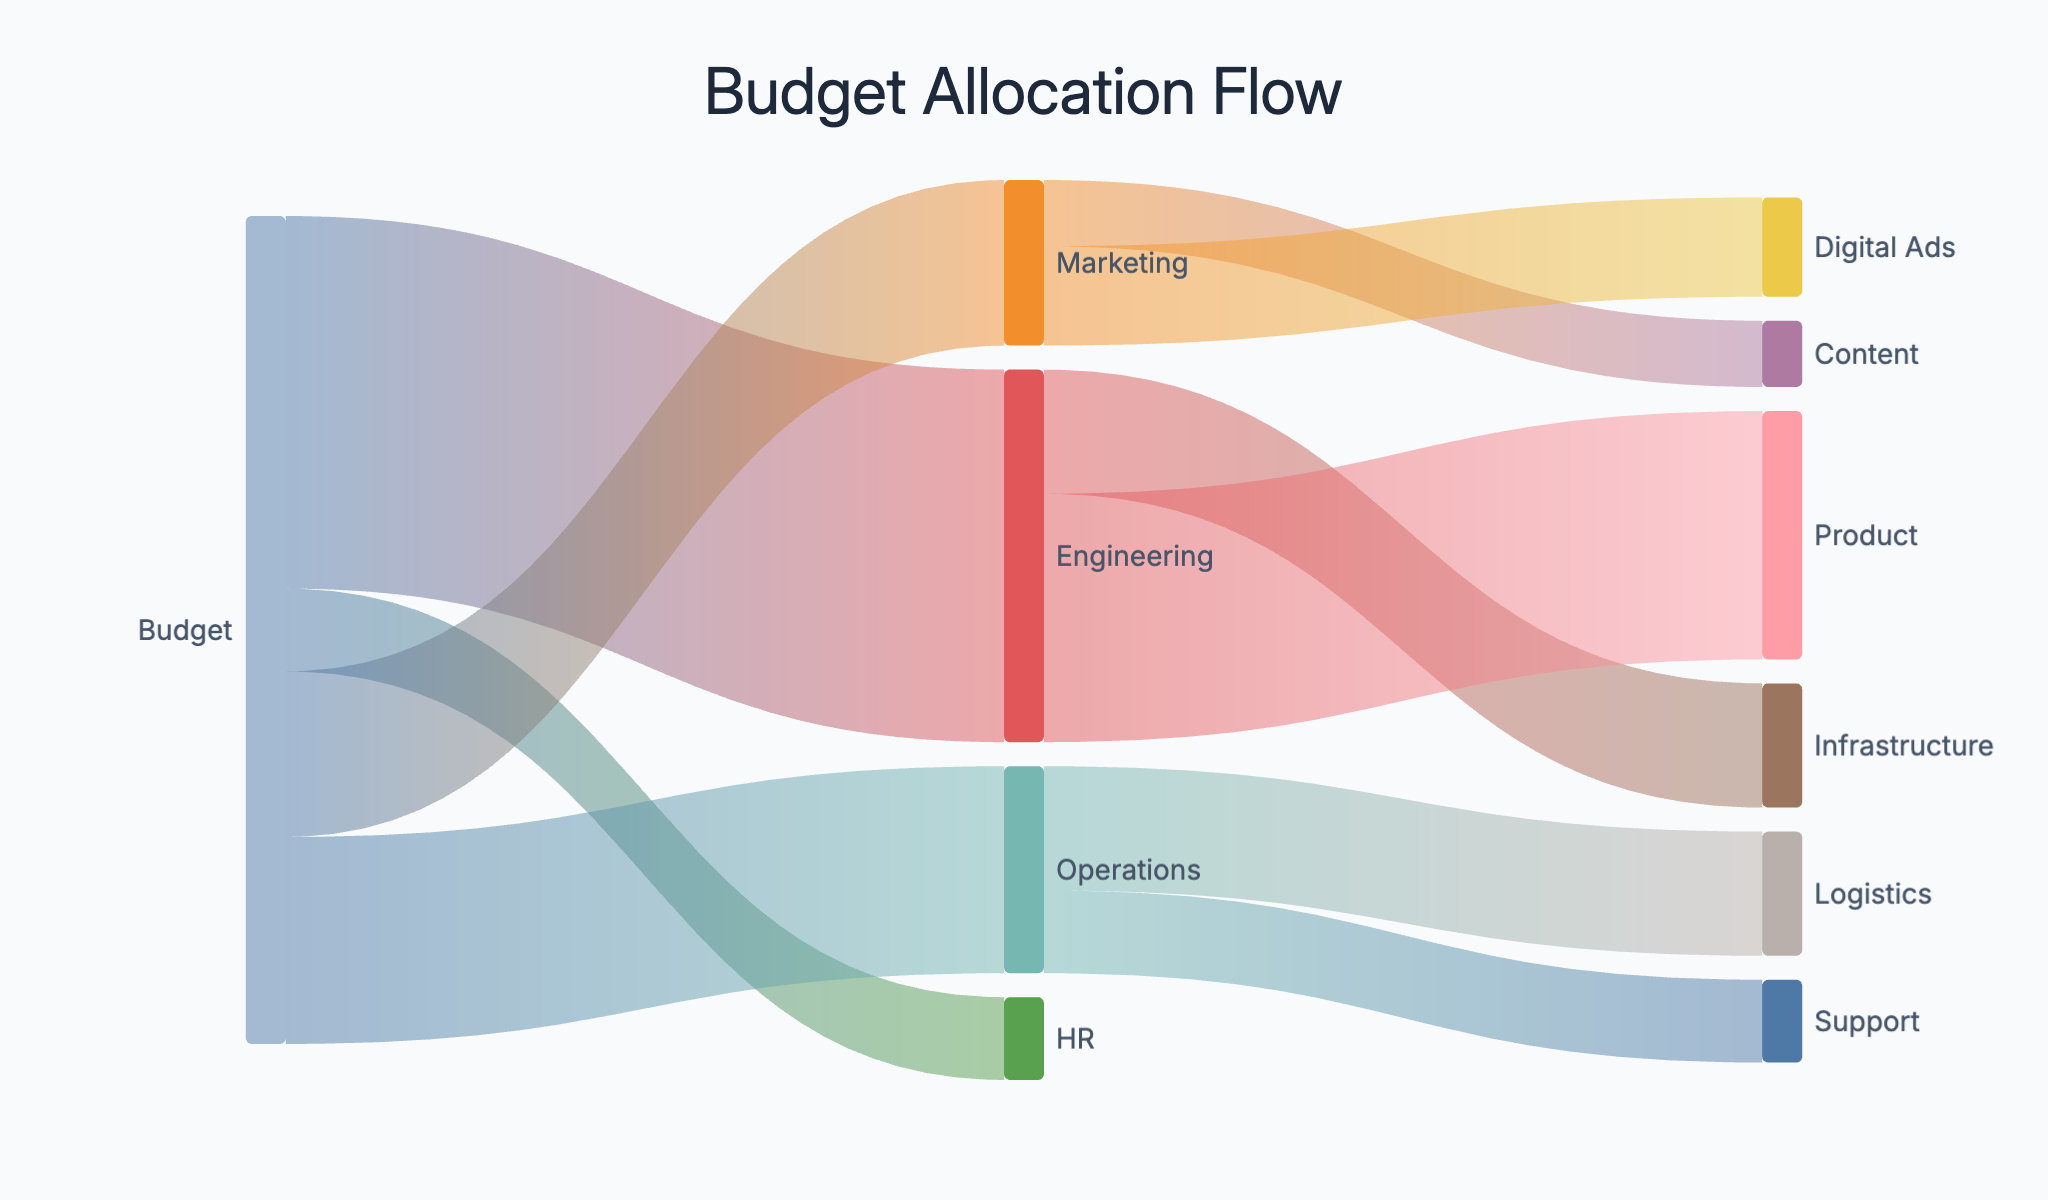
Create Sankey Diagram for Free

Sankey diagram example

Map how quantities flow between sources and destinations. Link width represents the magnitude of each flow — energy, budget allocation, user journeys, revenue by channel.

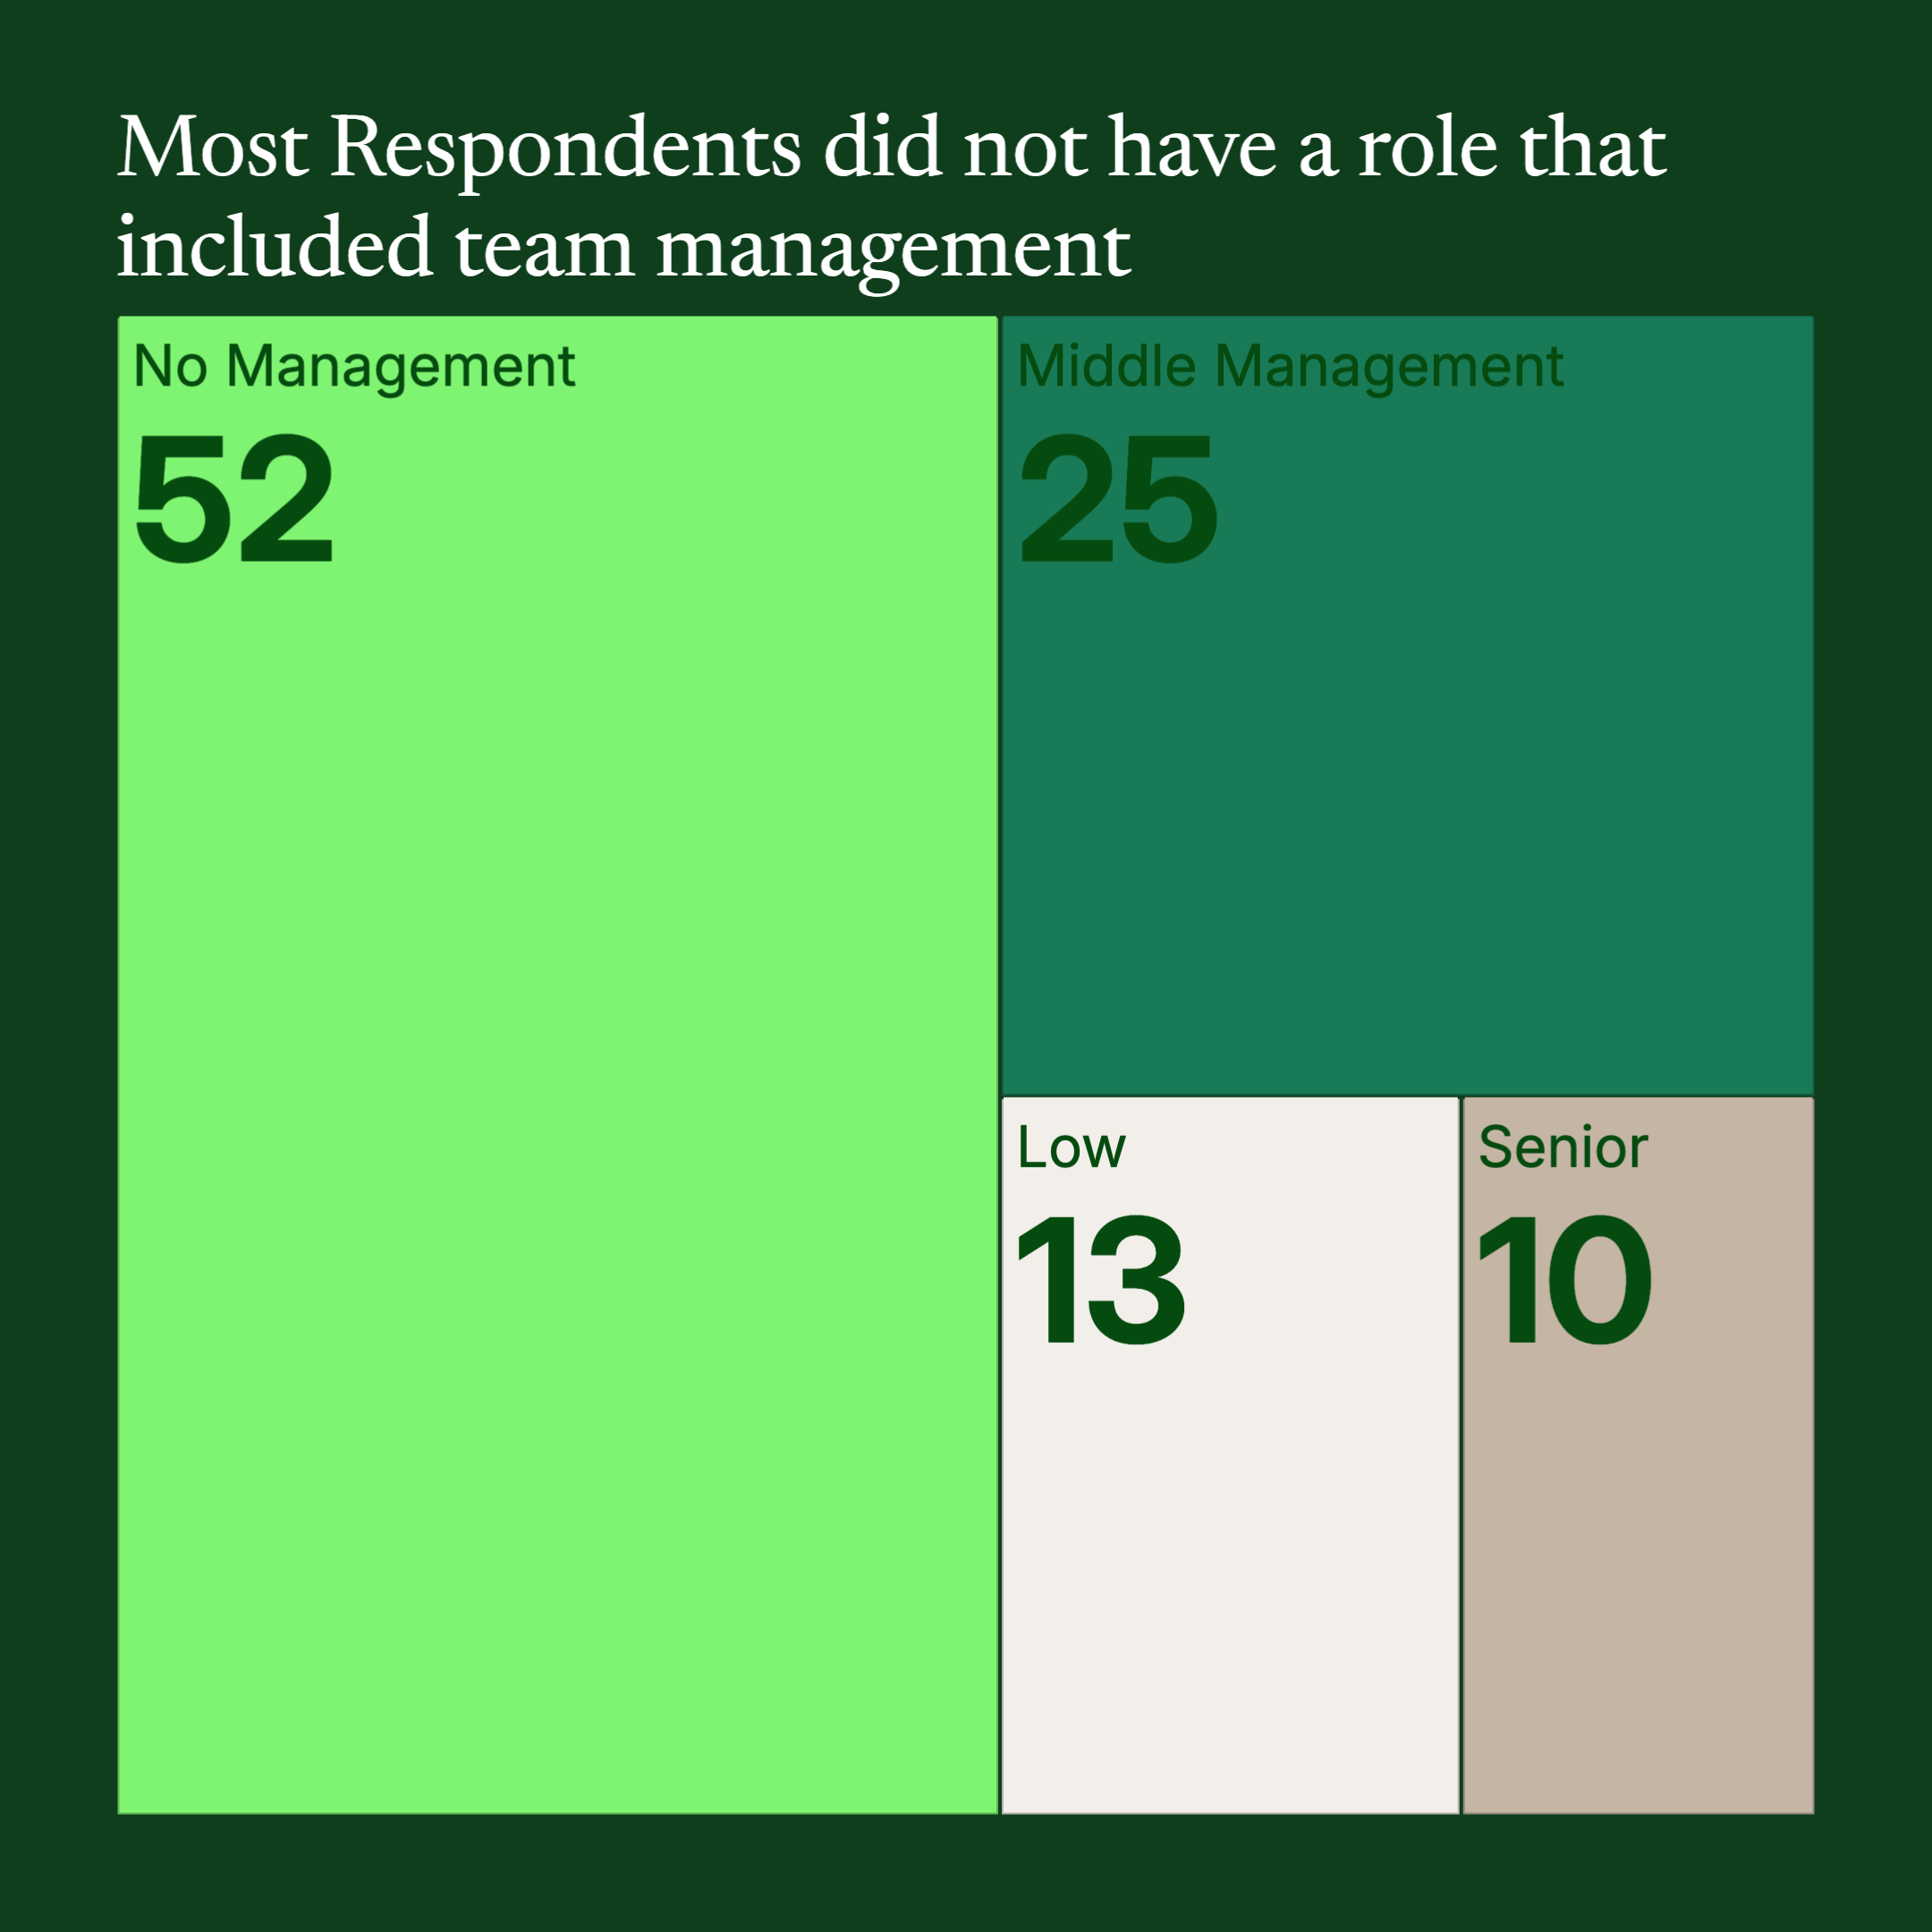
Create Treemap for Free

Treemap chart example

Display hierarchical data as nested rectangles sized by value. Budget breakdowns, revenue by segment, portfolio composition — proportions are instantly readable across two levels.

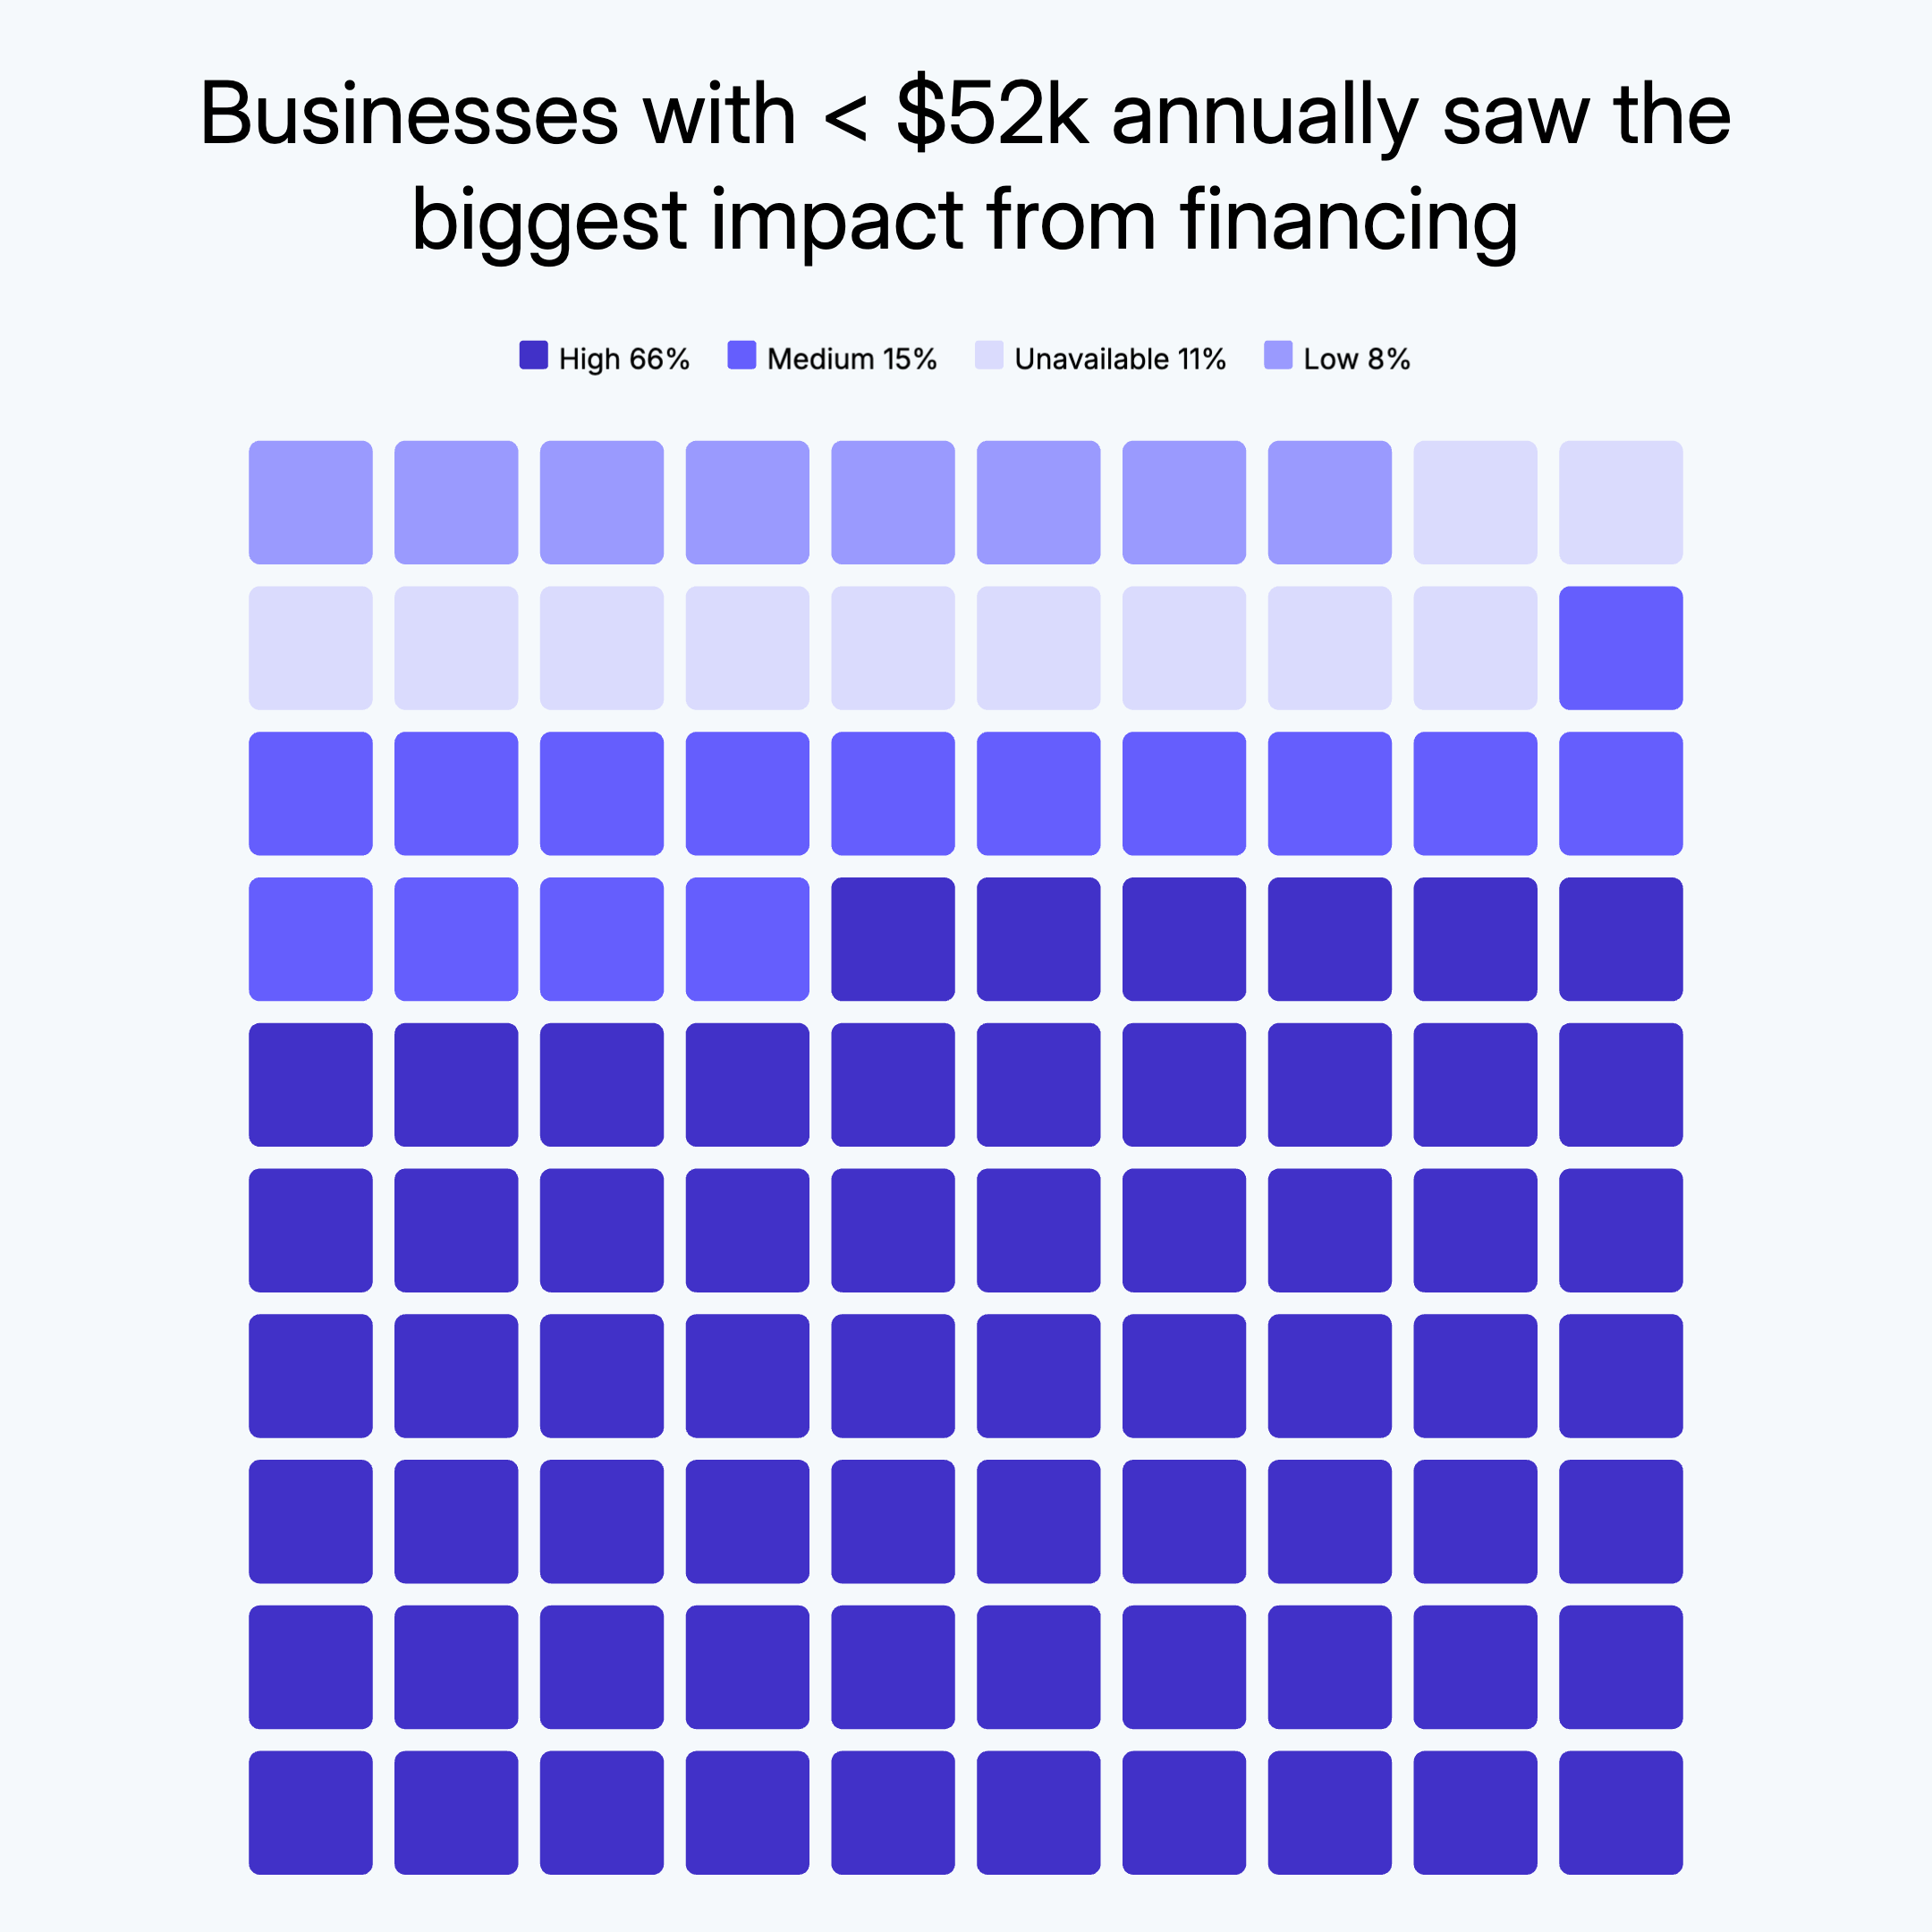
Create Waffle Chart for Free

Waffle chart example

A 10×10 grid where filled squares represent a percentage. A visual alternative to pie charts for showing progress, completion, or part-to-whole data.

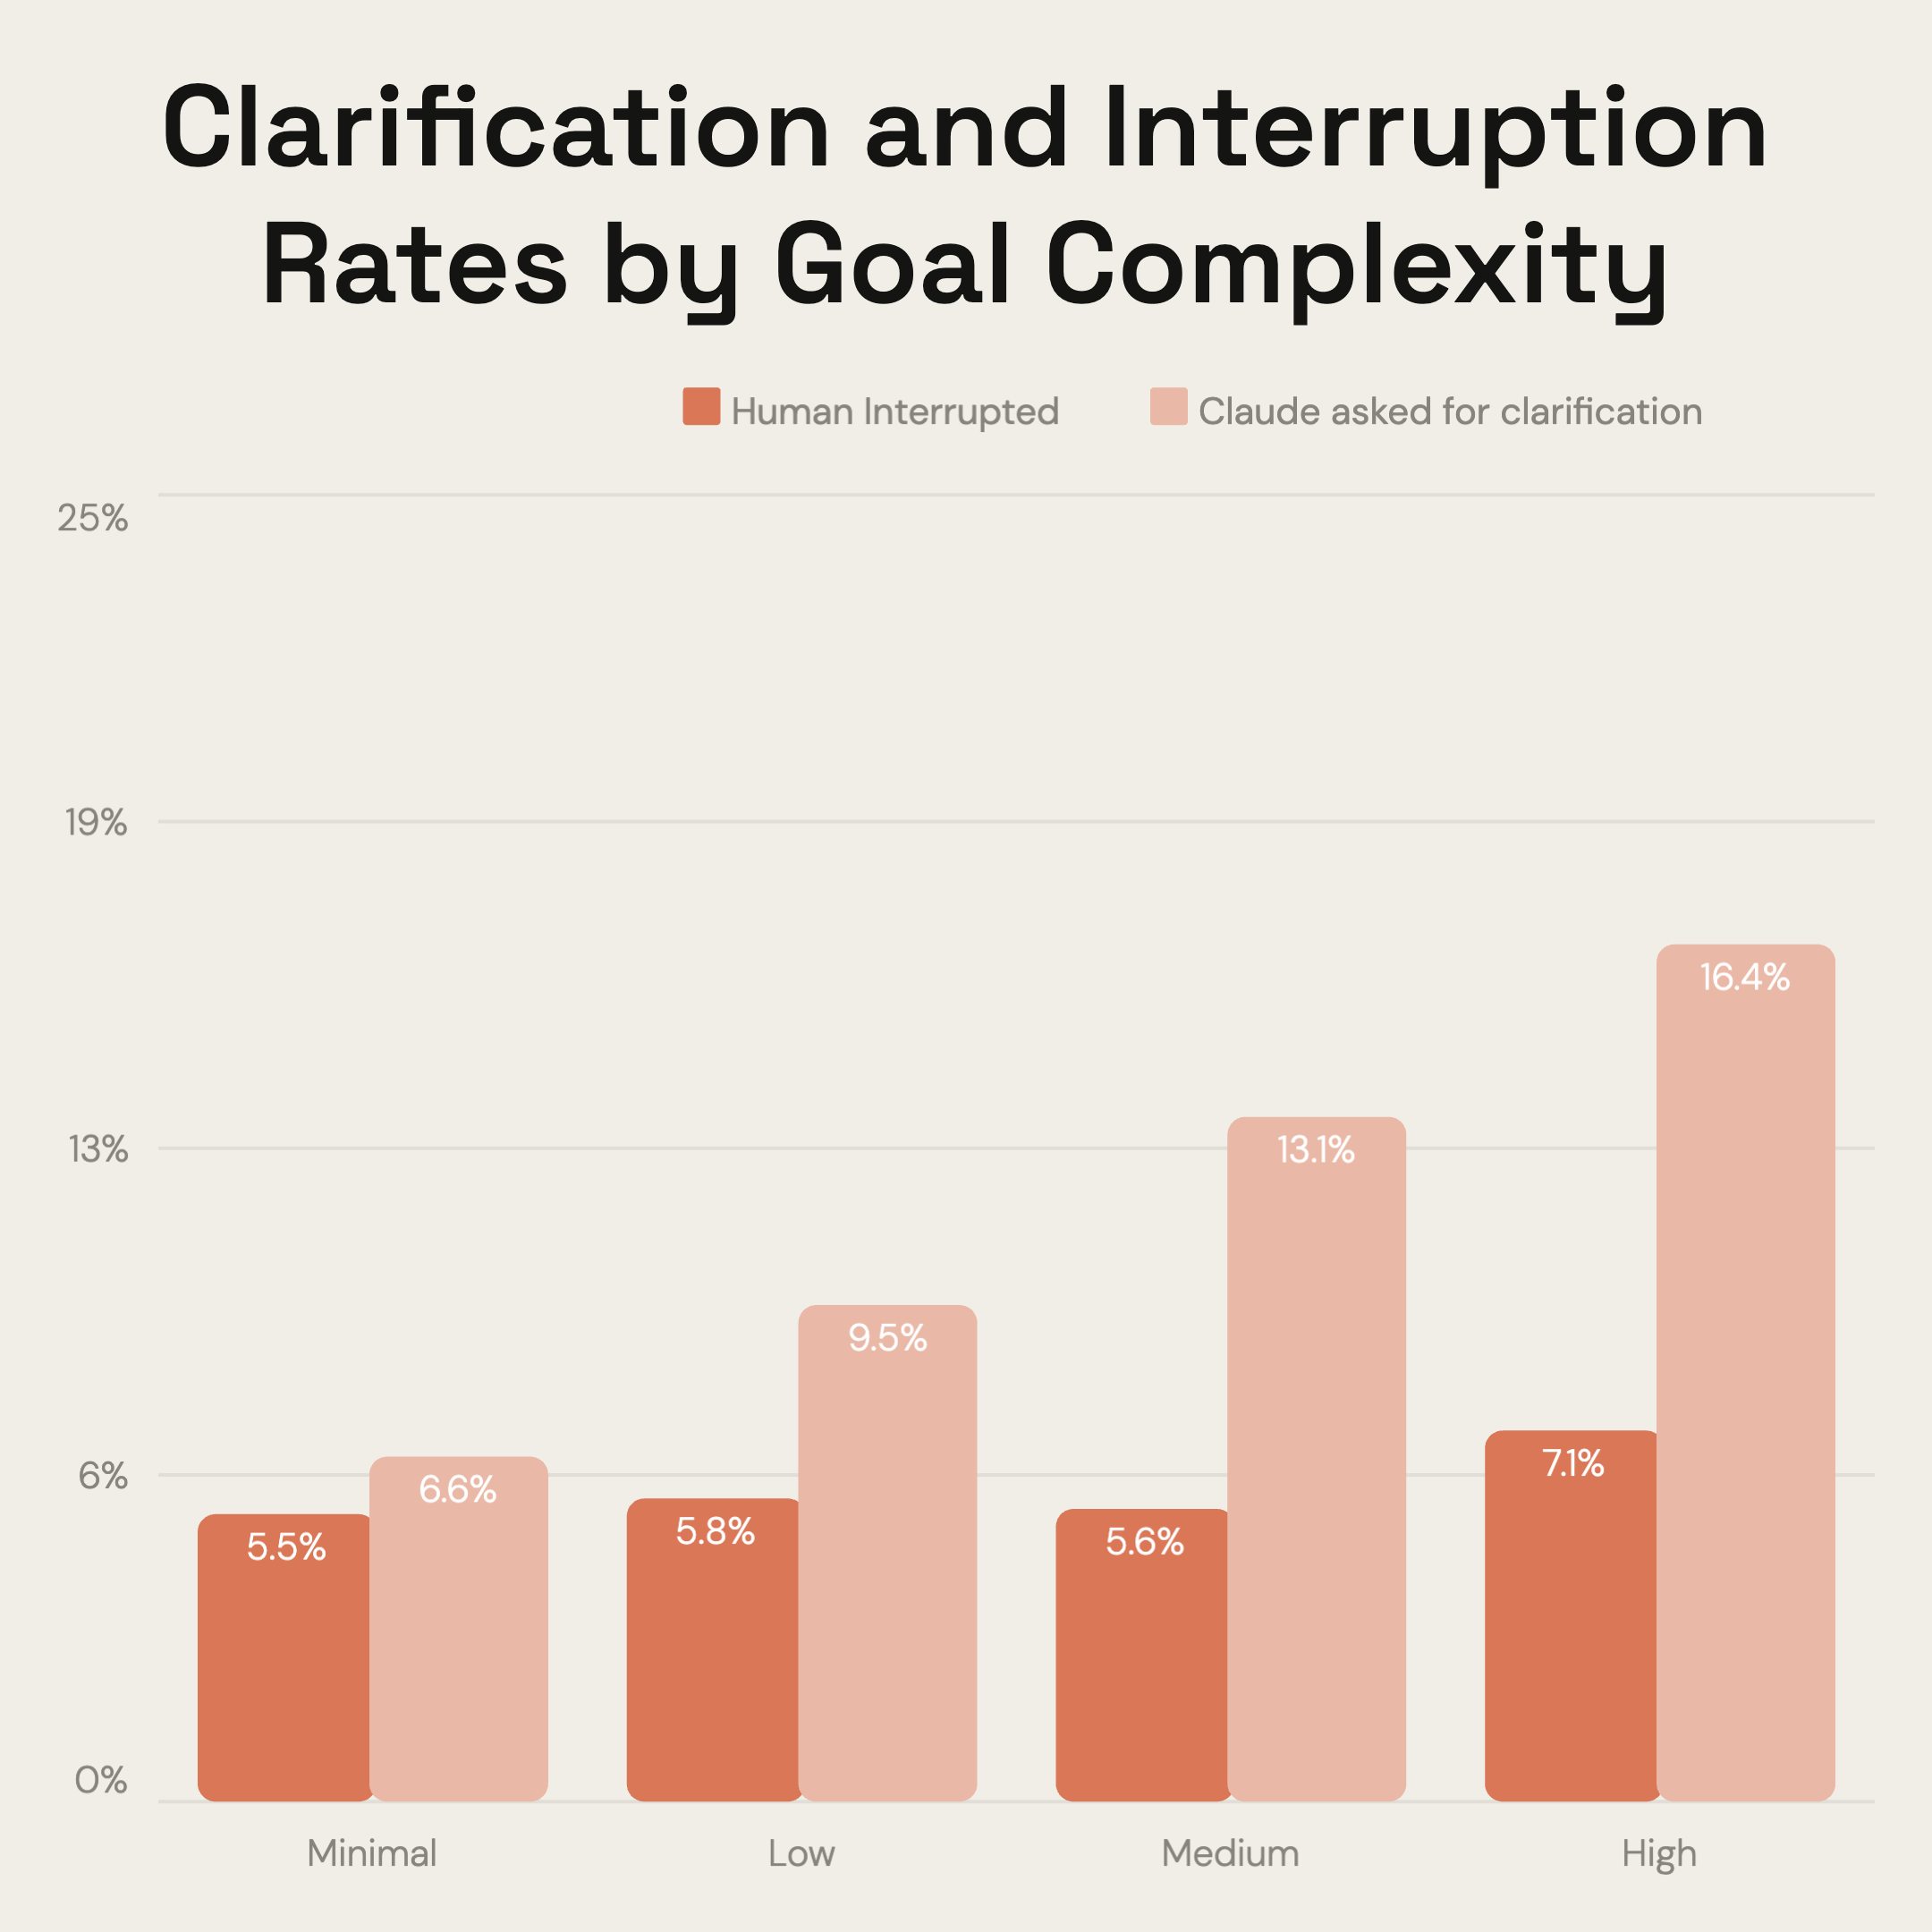
Create Grouped Bar Chart for Free

Grouped bar chart example

Multiple bars per category, side by side — year-over-year, budget vs actual, regional breakdowns. Each series gets its own color and legend entry.

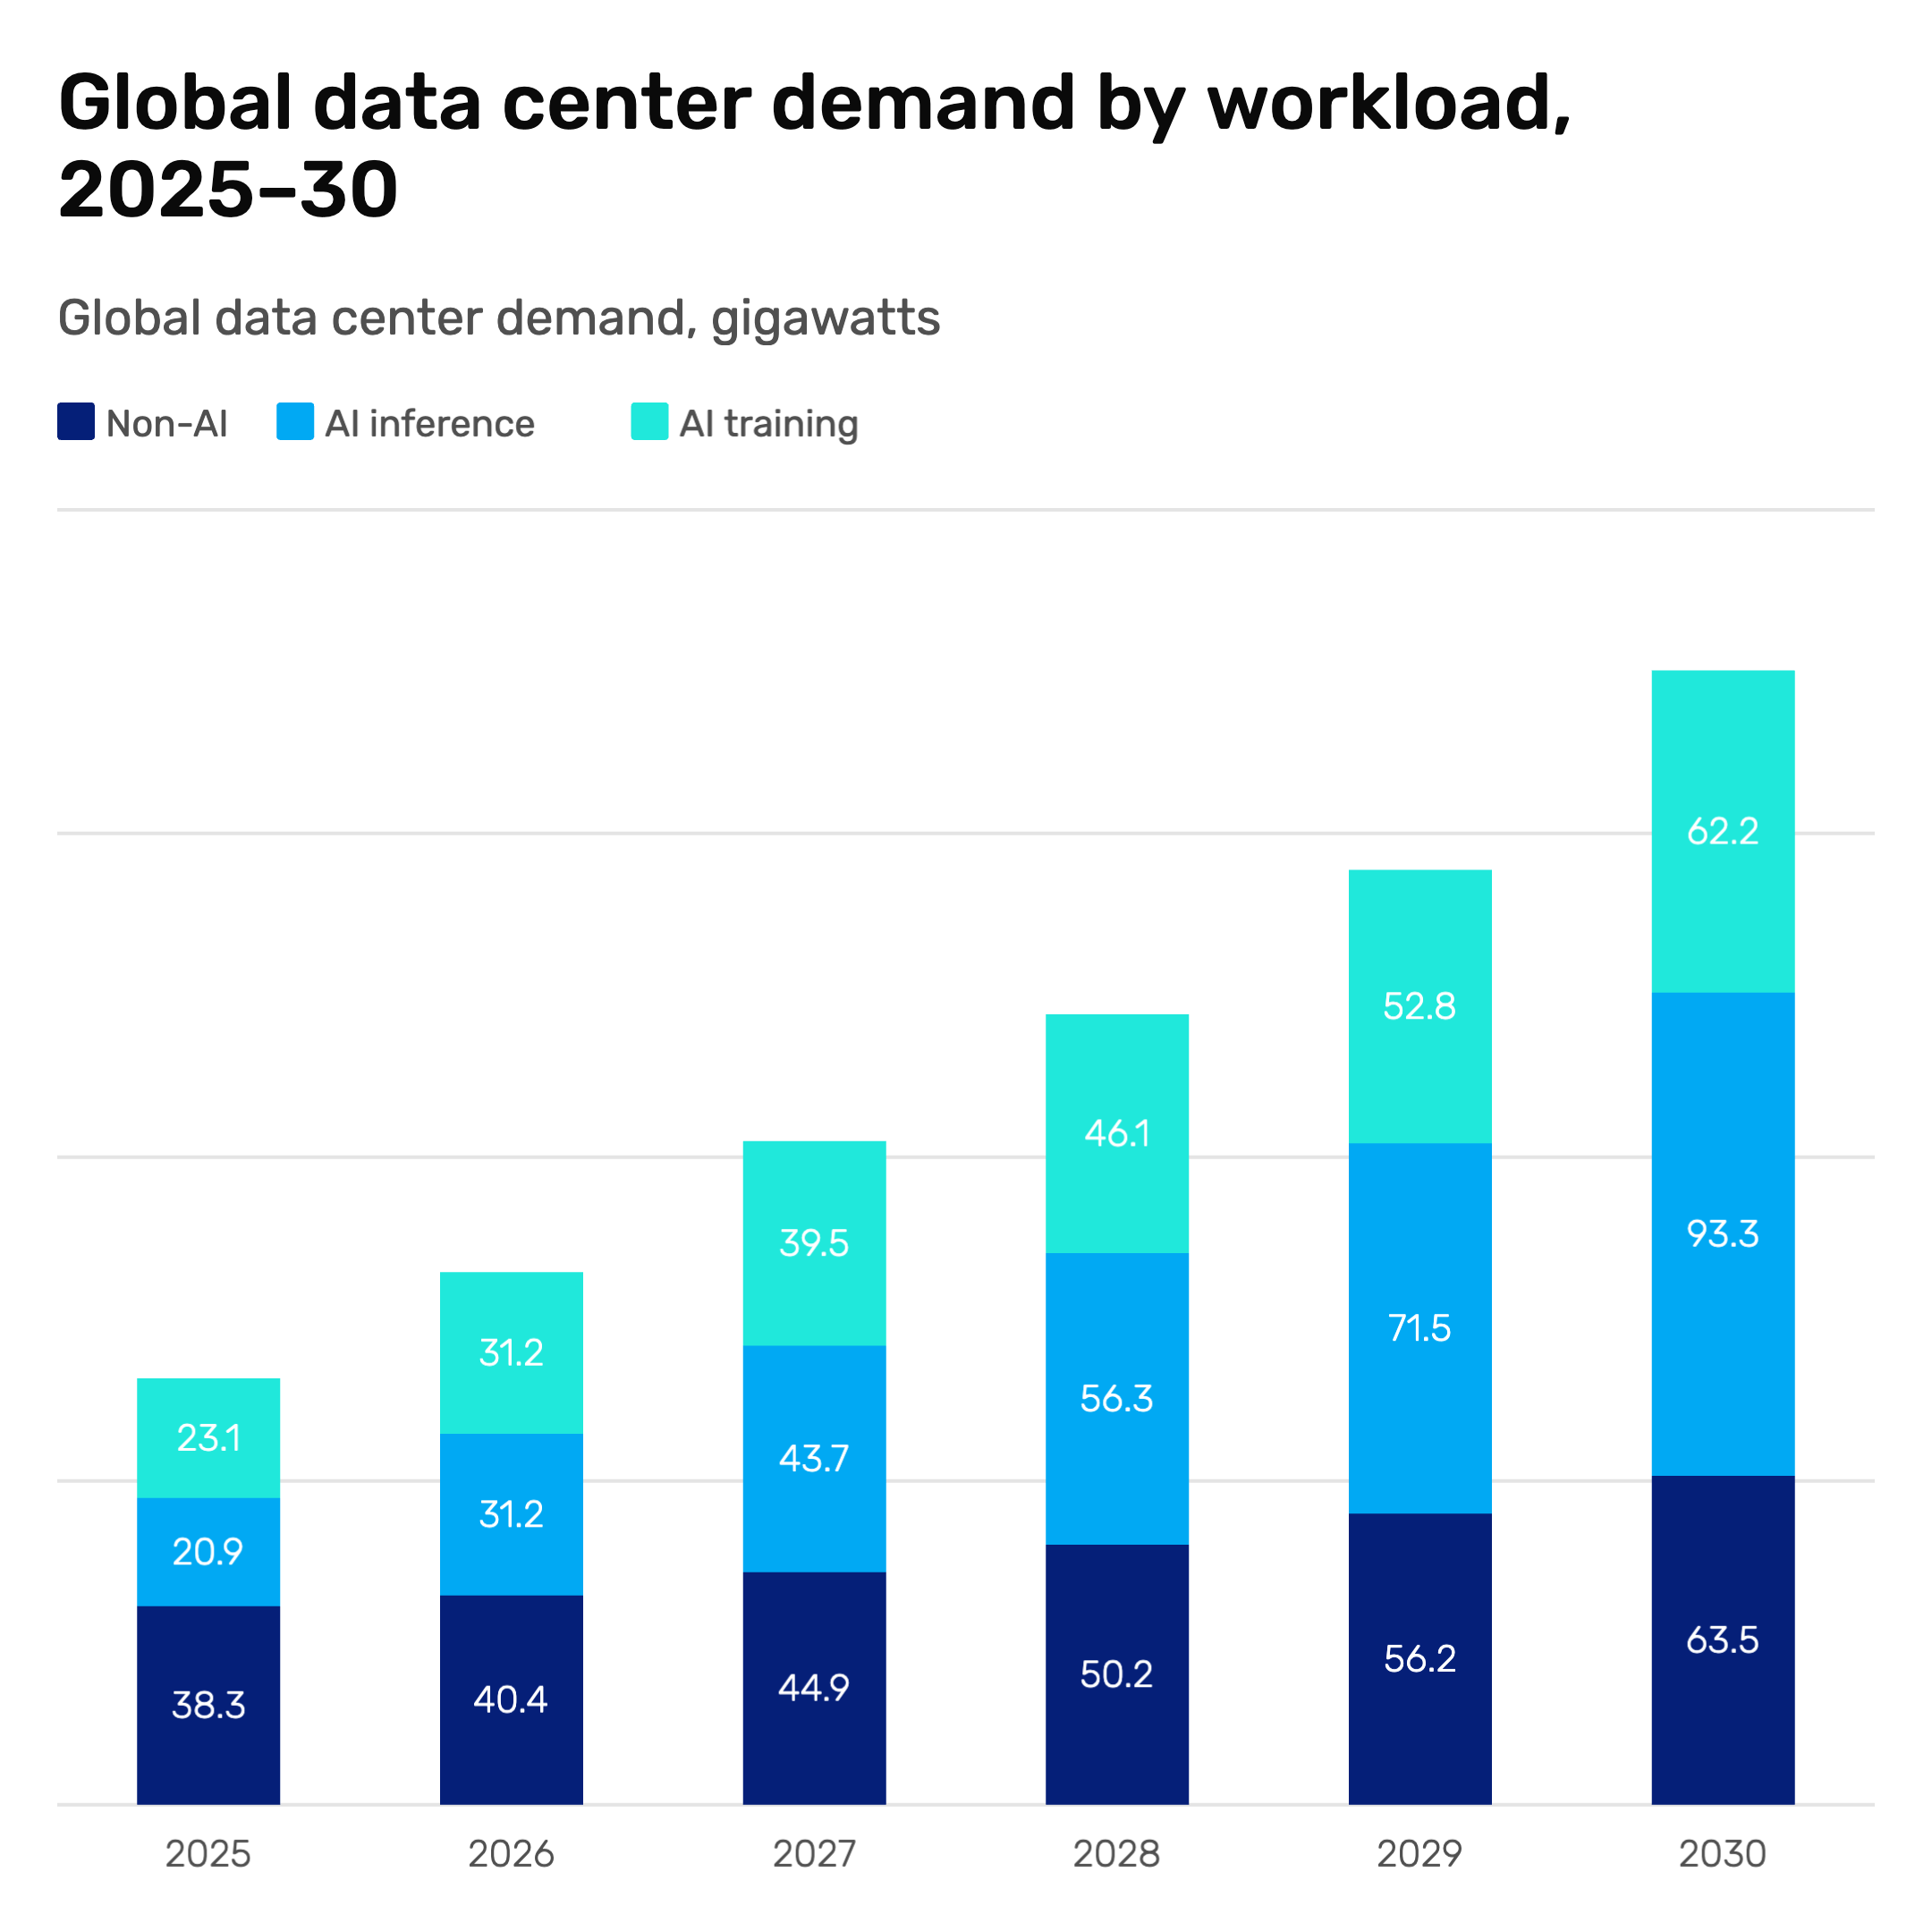
Create Stacked Bar Chart for Free

Stacked bar chart example

Bars divided into colored segments — shows totals and composition in one view. Revenue by product line, headcount by team, traffic by channel.

Create Dumbbell Chart for Free

Dumbbell chart example

Two dots per category connected by a line. The gap between them tells the story — before vs after, plan vs actual, this year vs last year.

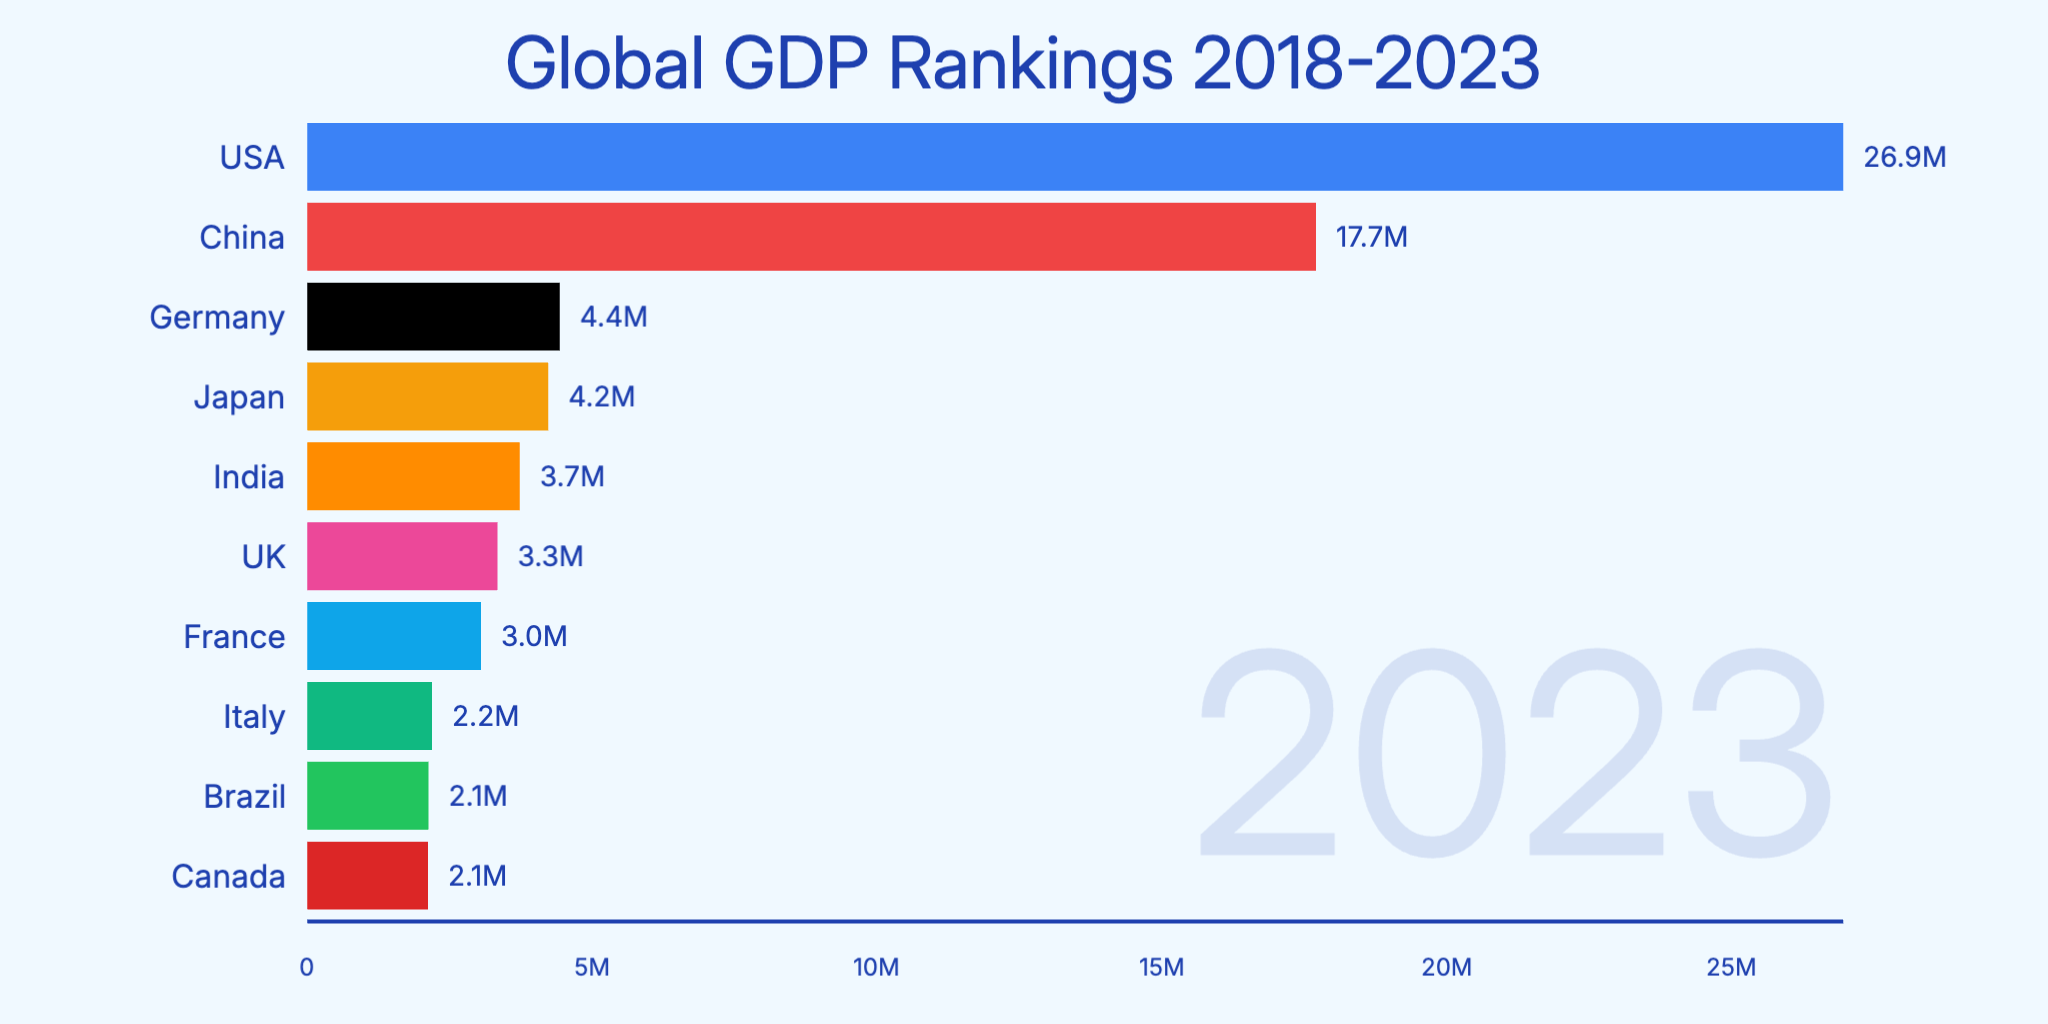
Create Bar Race Chart for Free

Bar race chart example

Horizontal bars animate and reorder as rankings change over time. One of the most shared chart formats on social media — GDP by country, revenue by company, popularity over years.

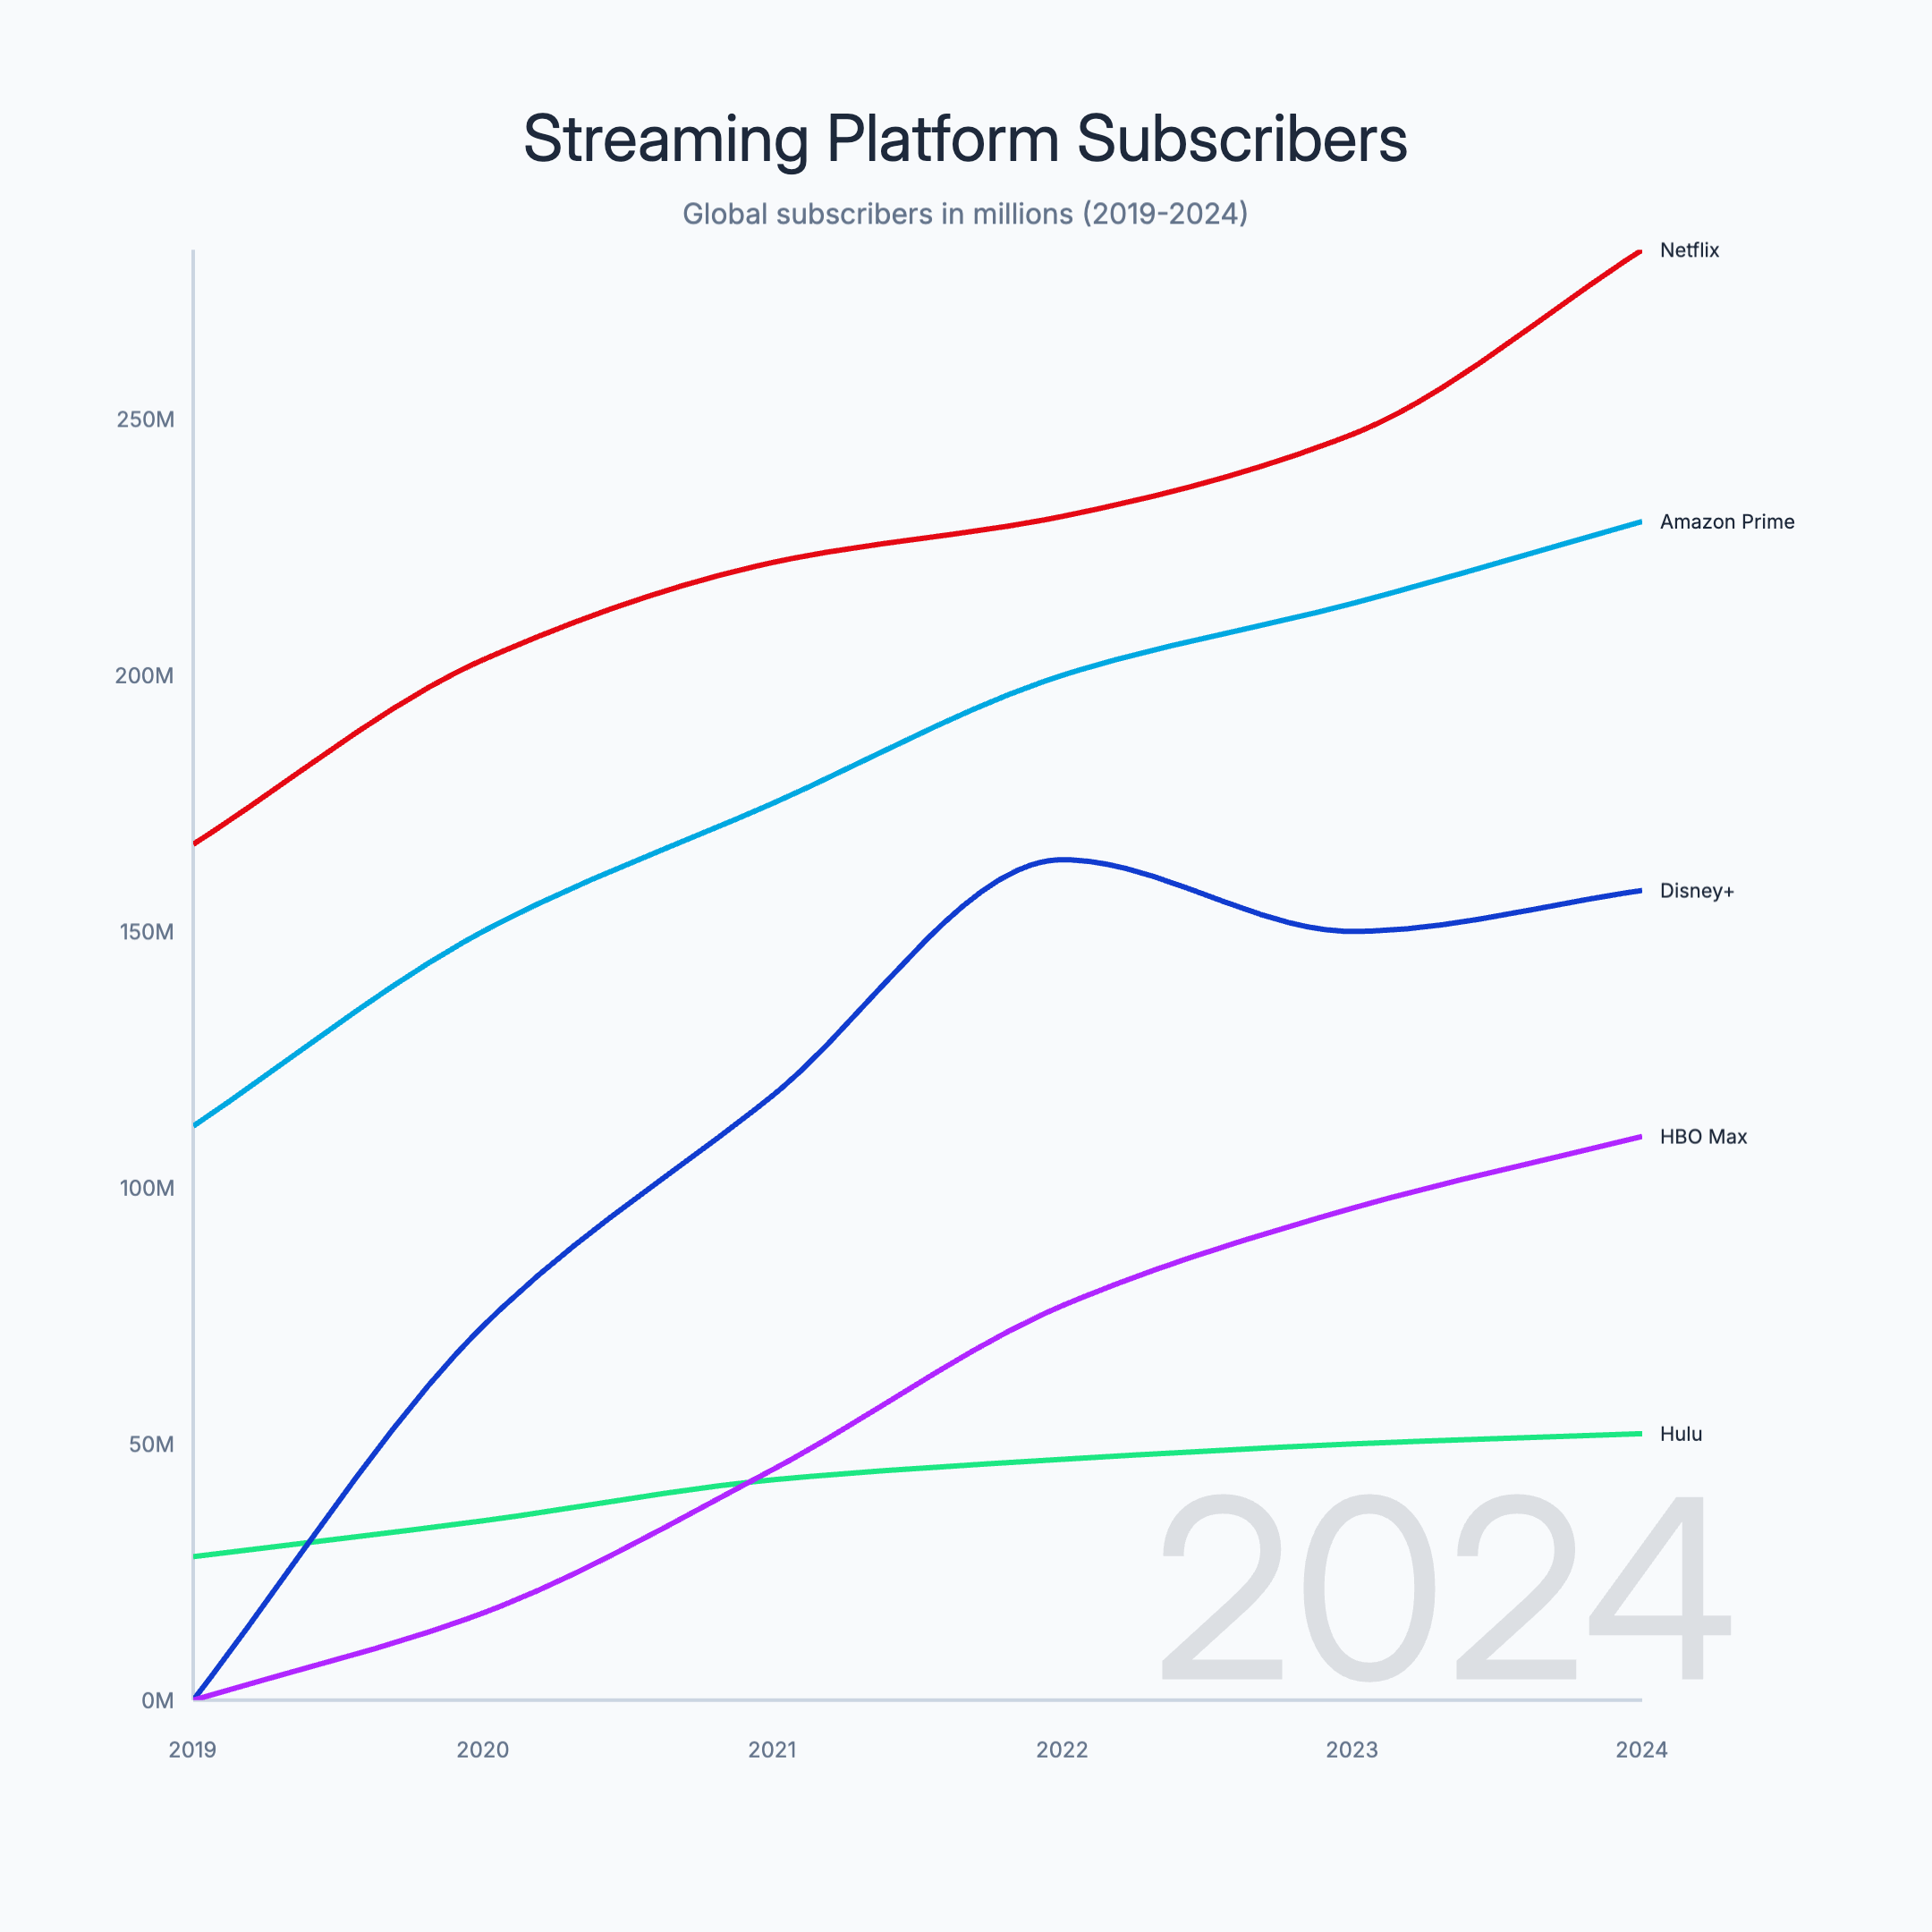
Create Line Race Chart for Free

Line race chart example

Multiple lines compete across time with live rankings shown alongside the chart. Great for showing how streaming platforms, brands, or products rise and fall in popularity.

Frequently Asked Questions

Start making charts for free

No account required. Unlimited image exports. Upgrade to Pro for animated video.