Free Chart Templates
Browse templates for column, waterfall, funnel, treemap, scatter, and 15+ more chart types. Import your data and drop the finished chart into PowerPoint or Google Slides.
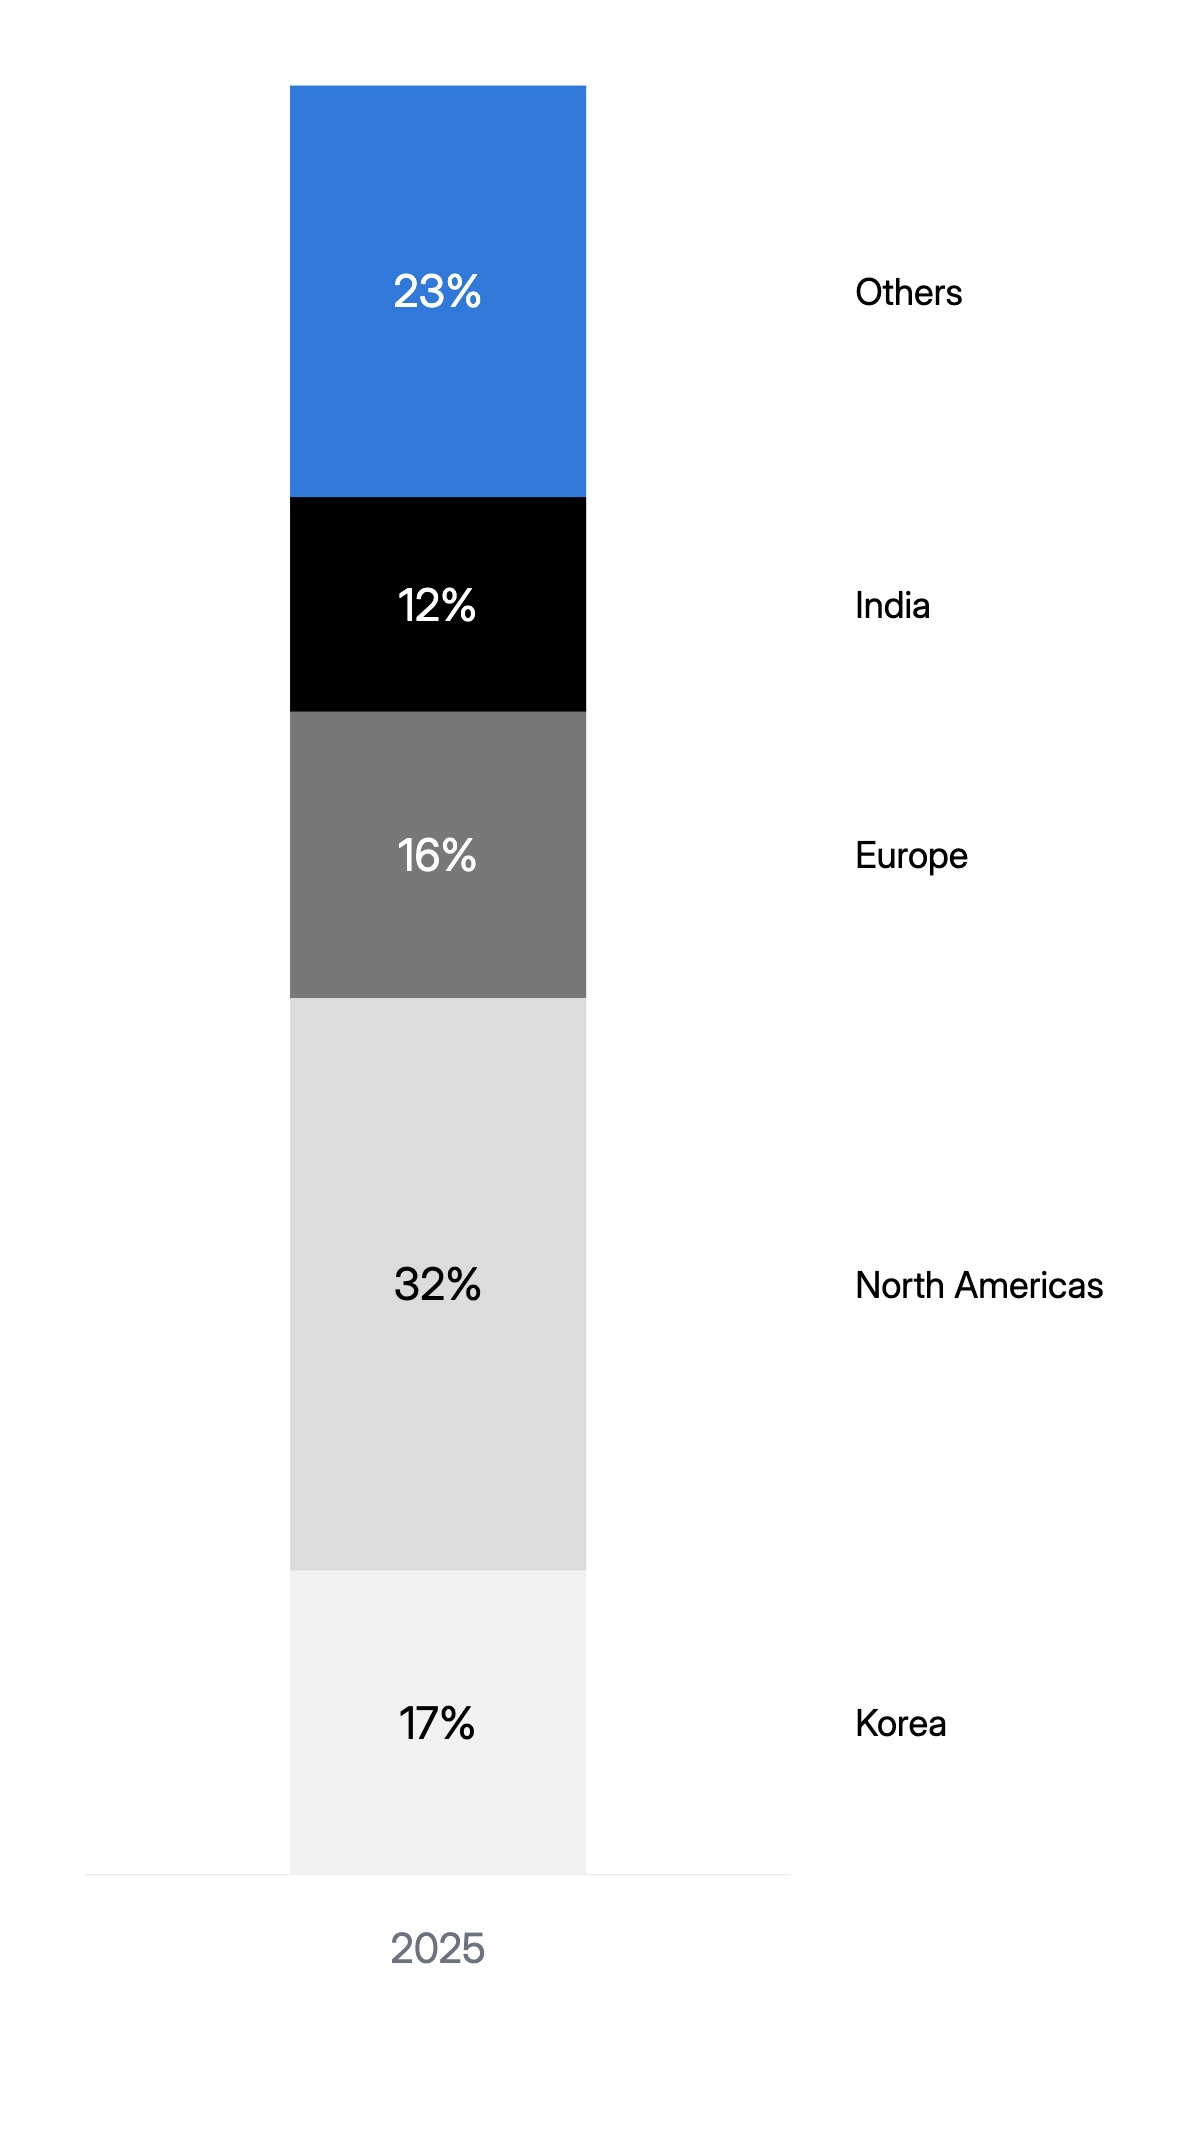
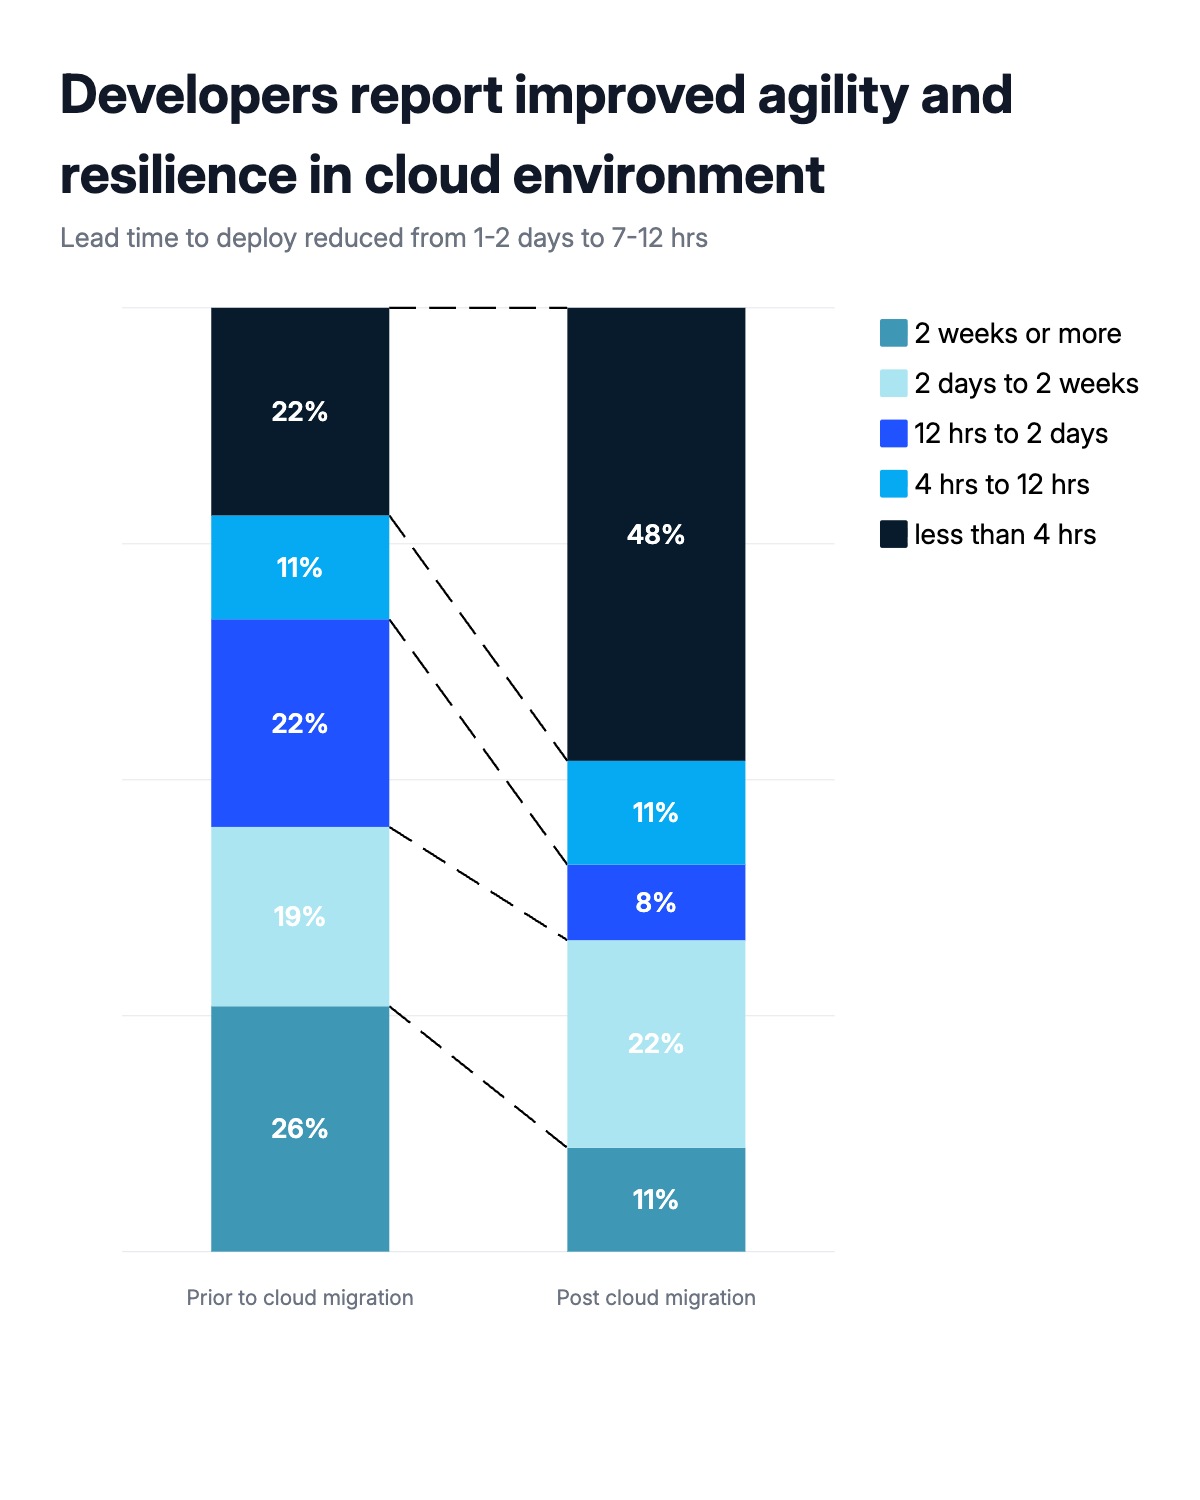
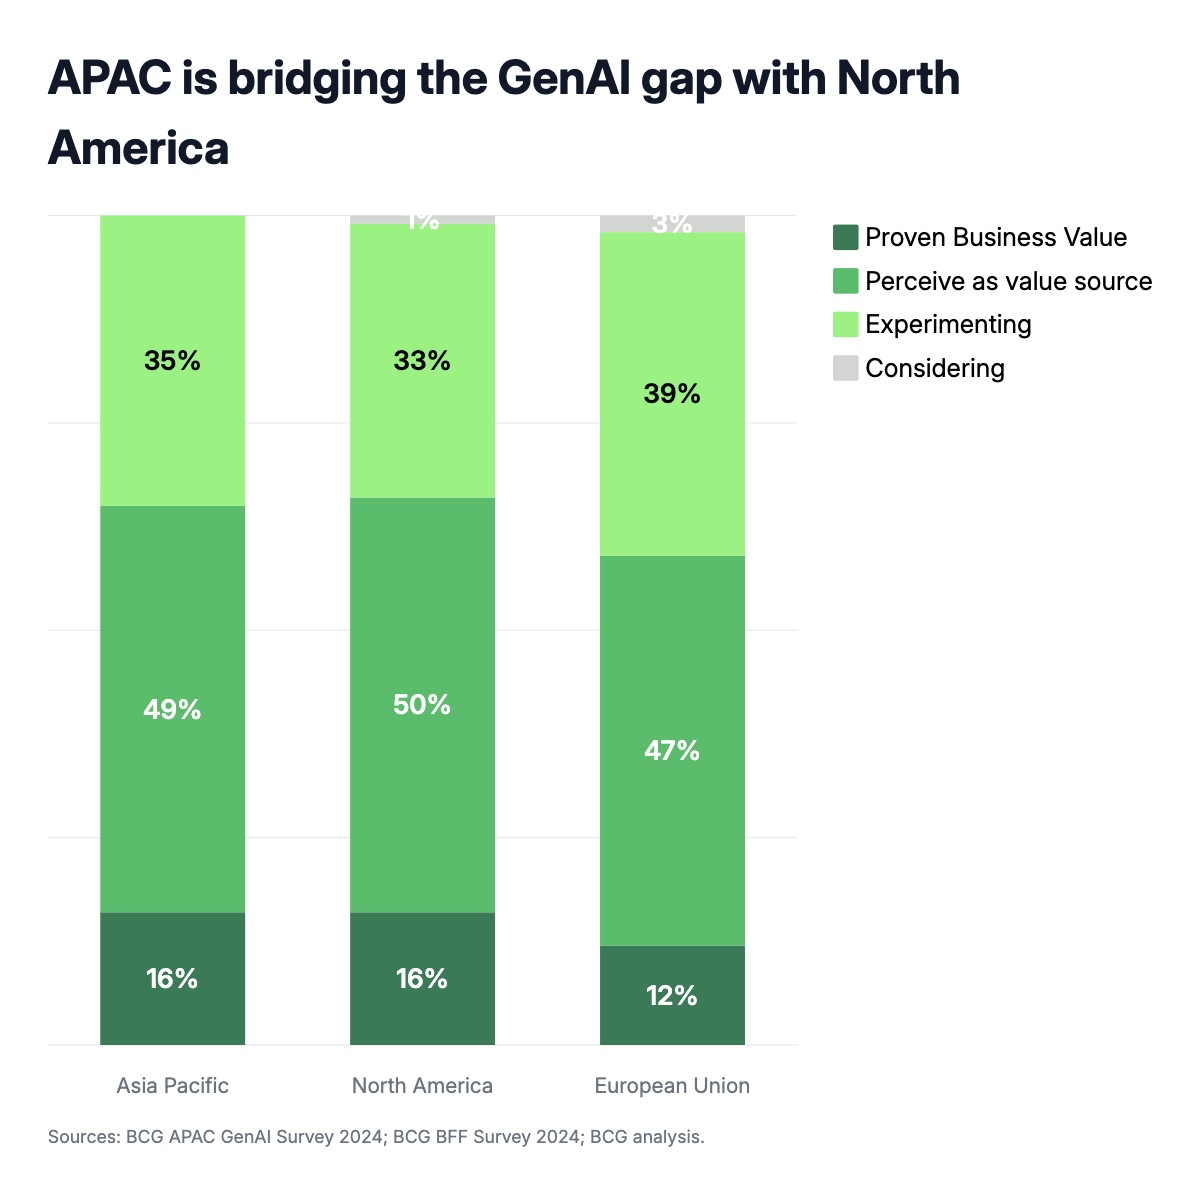
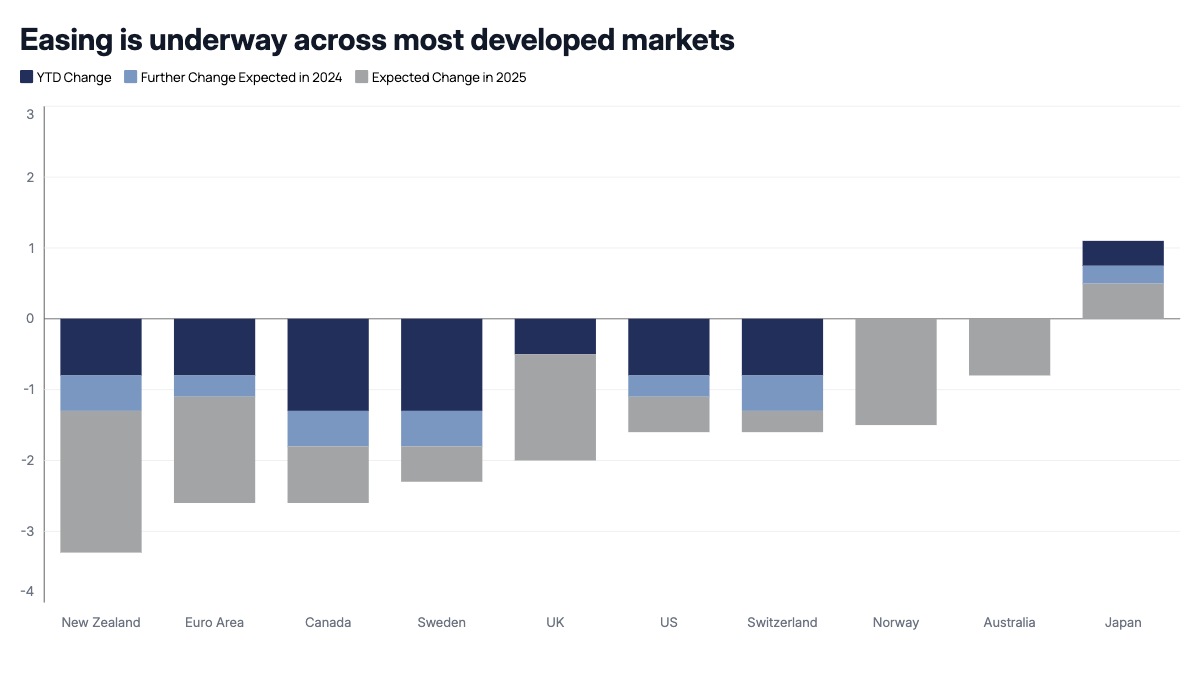
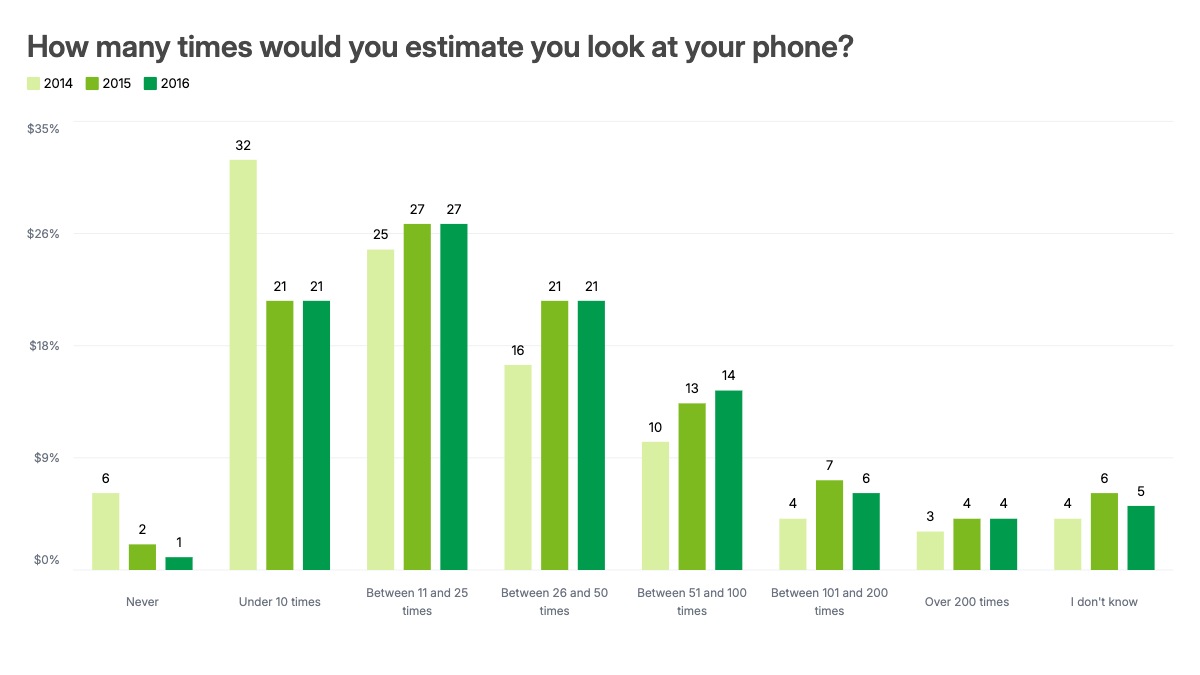
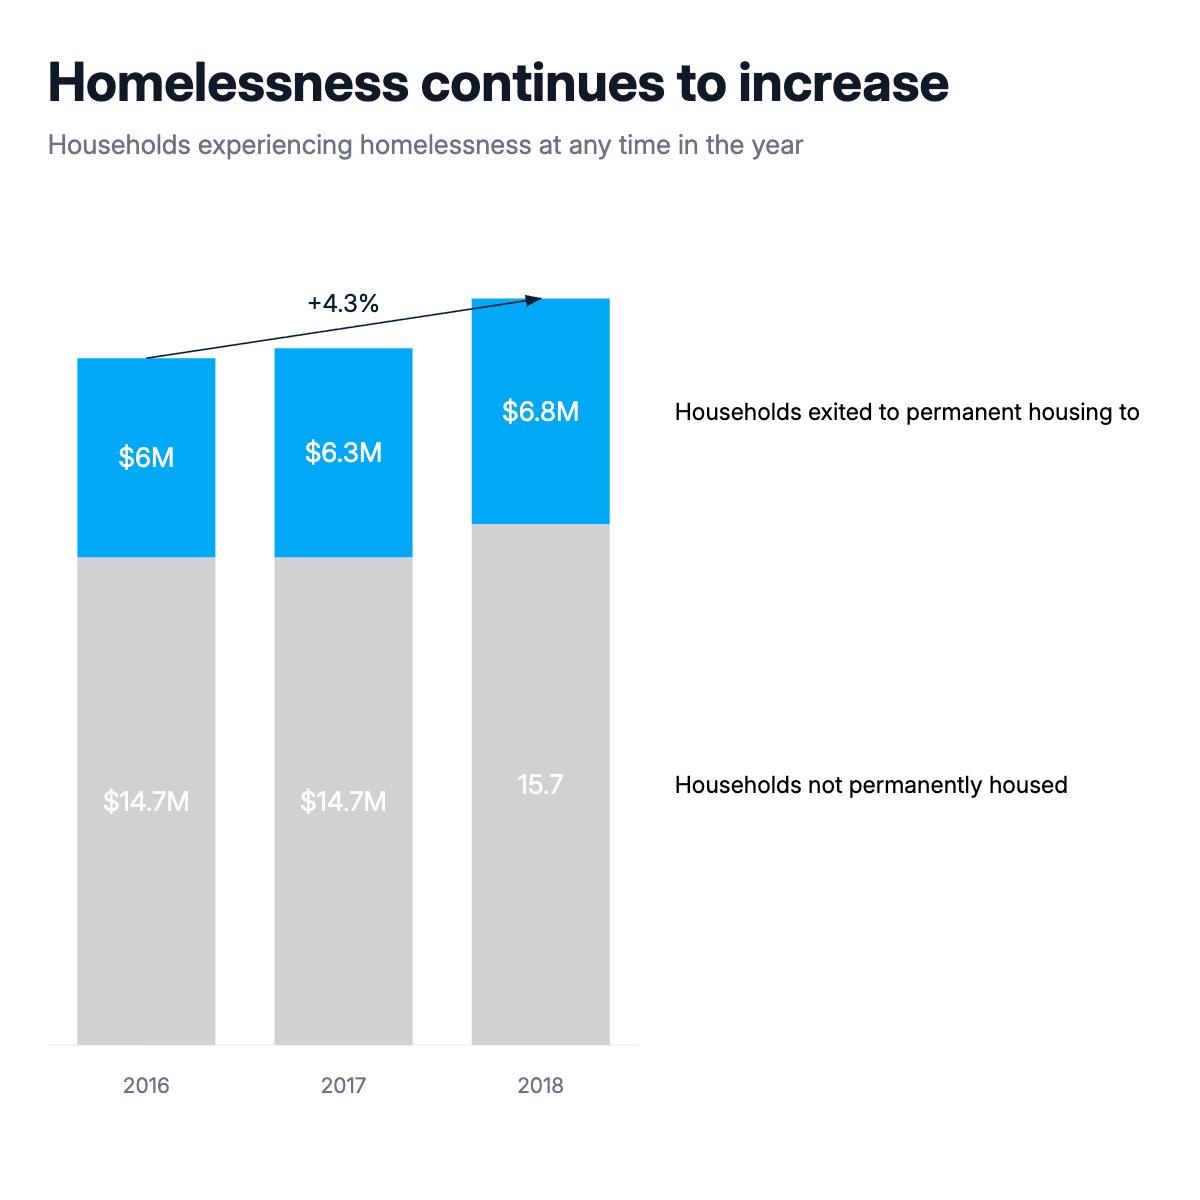
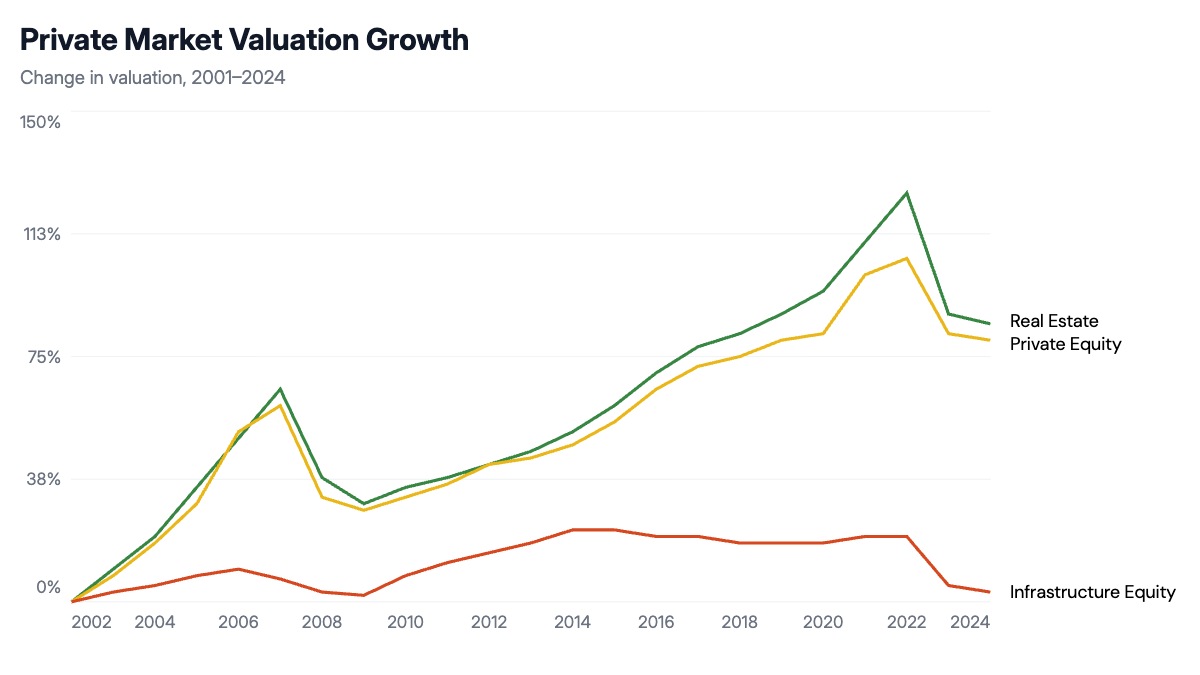
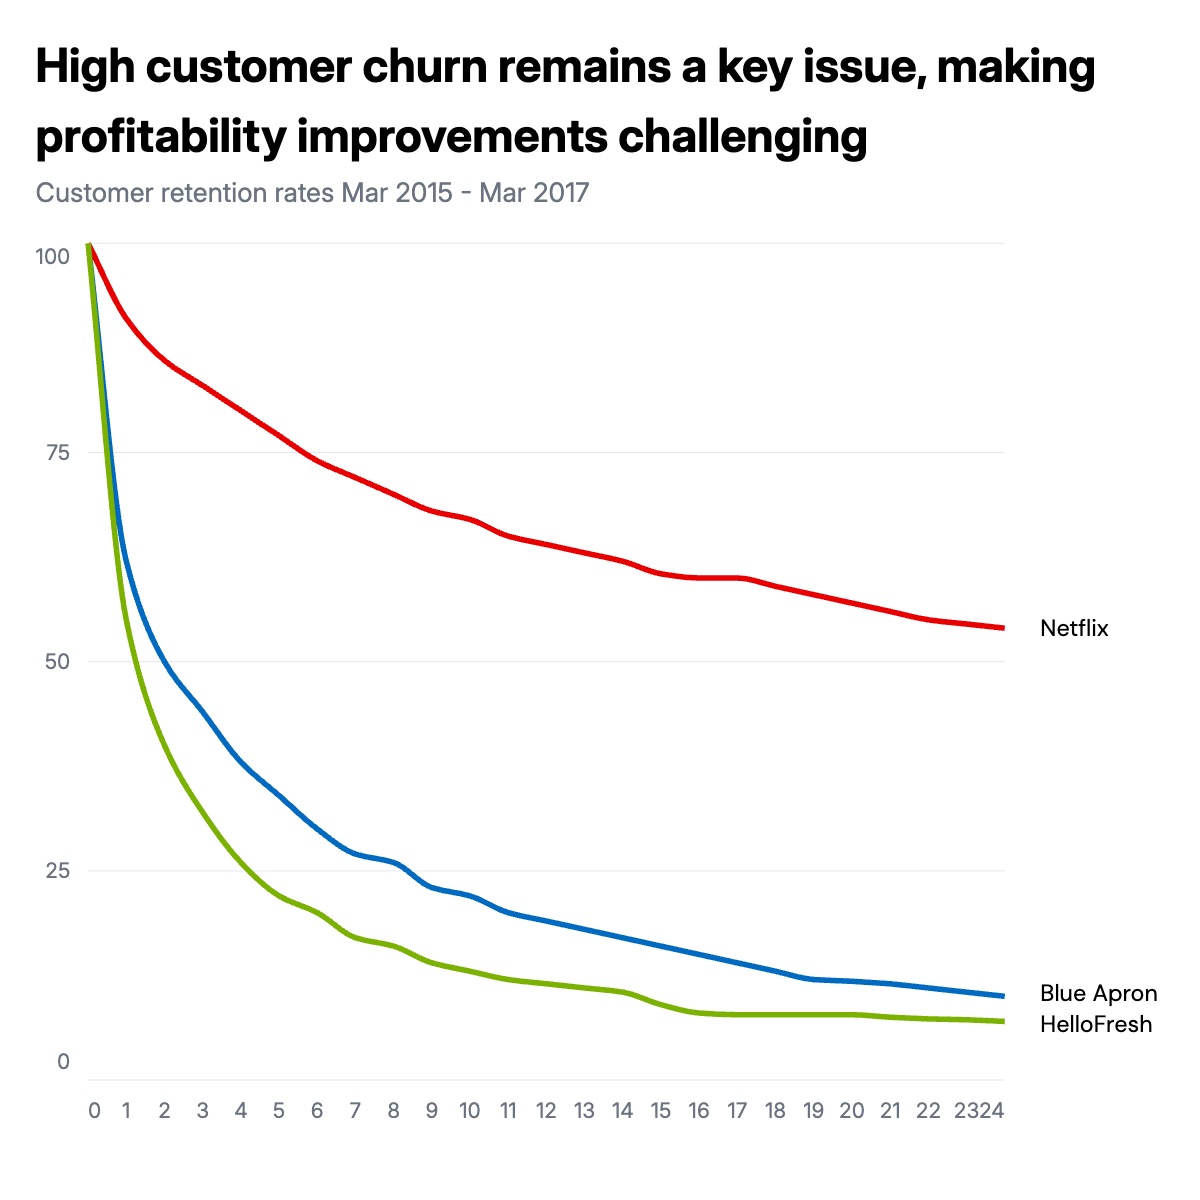
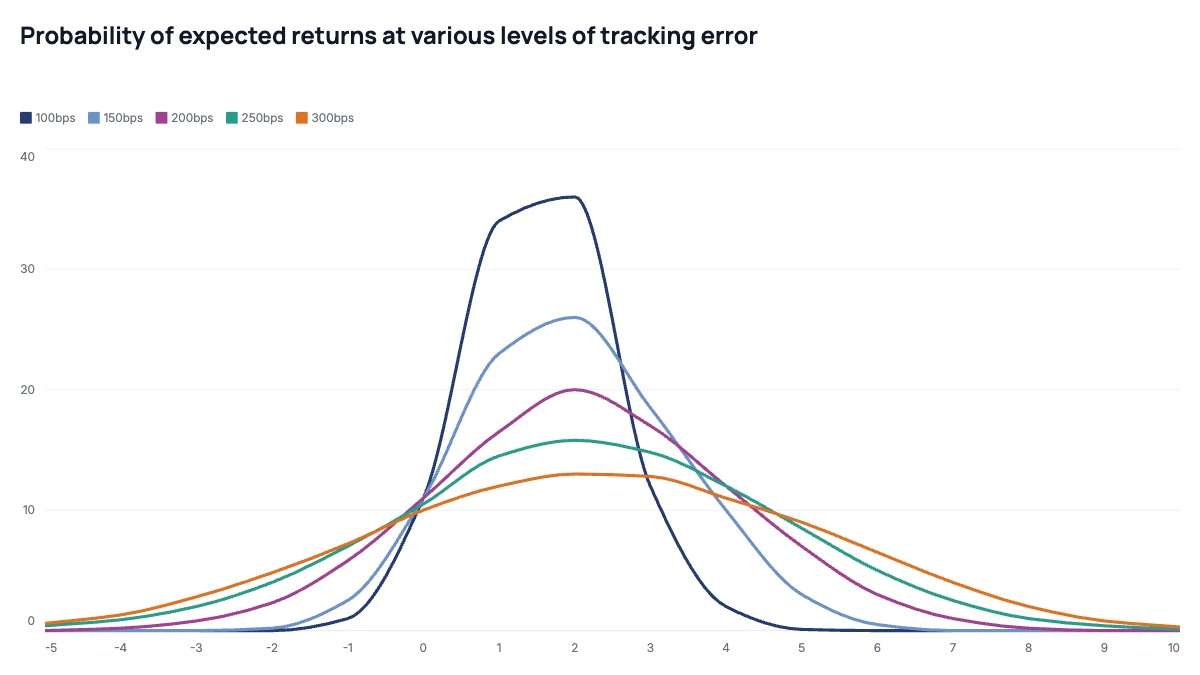
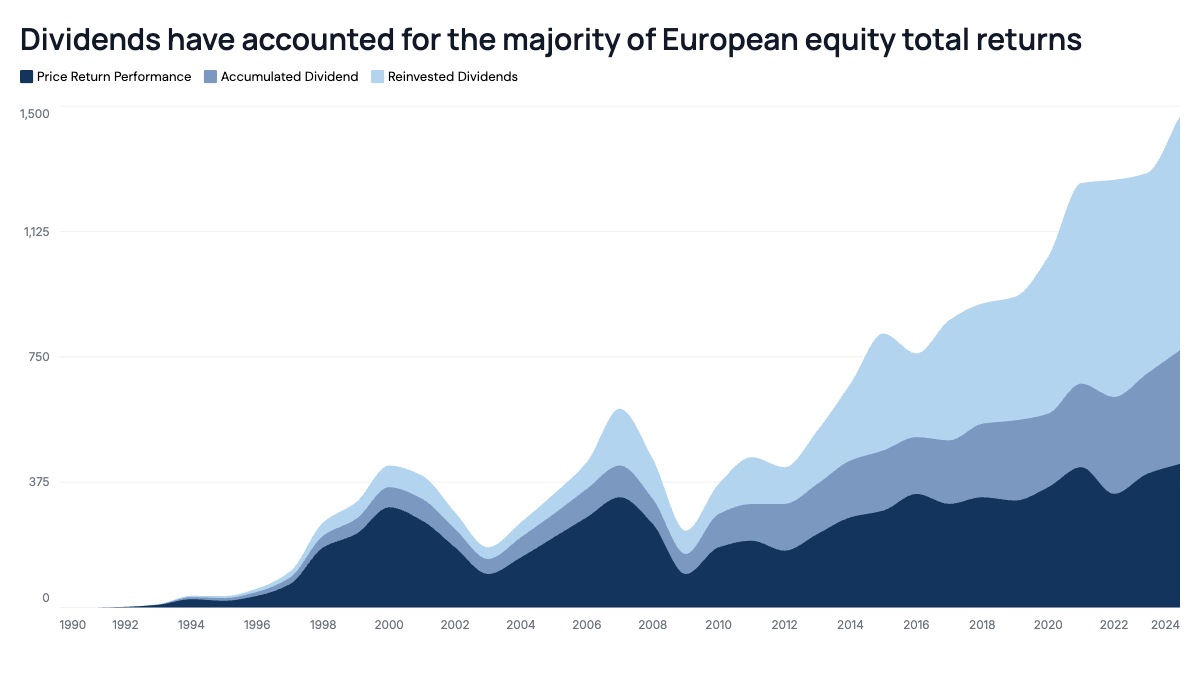
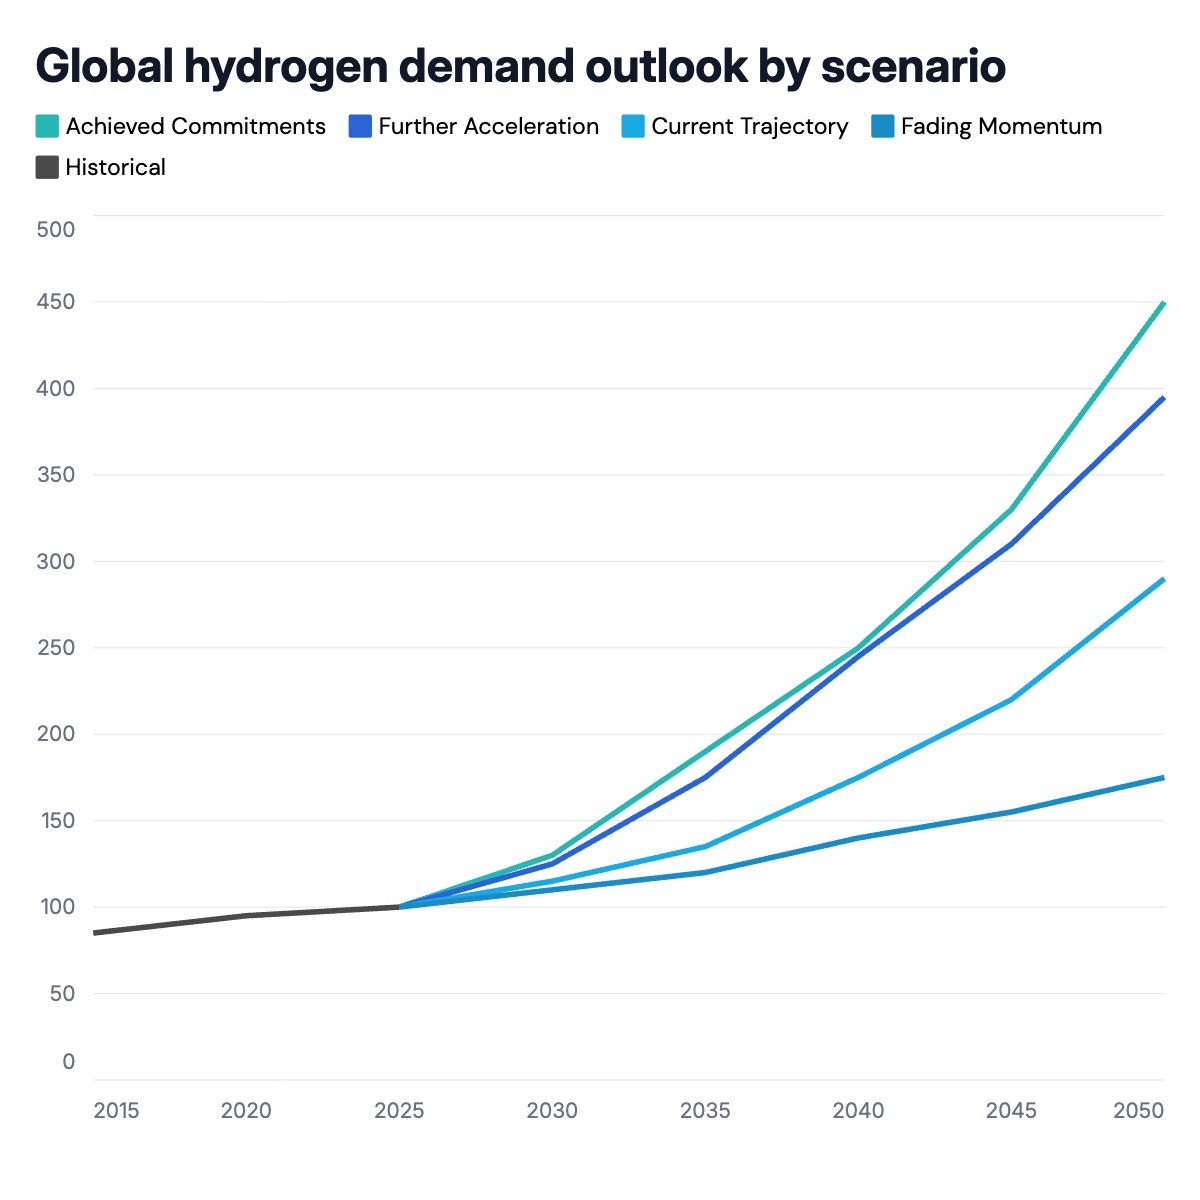
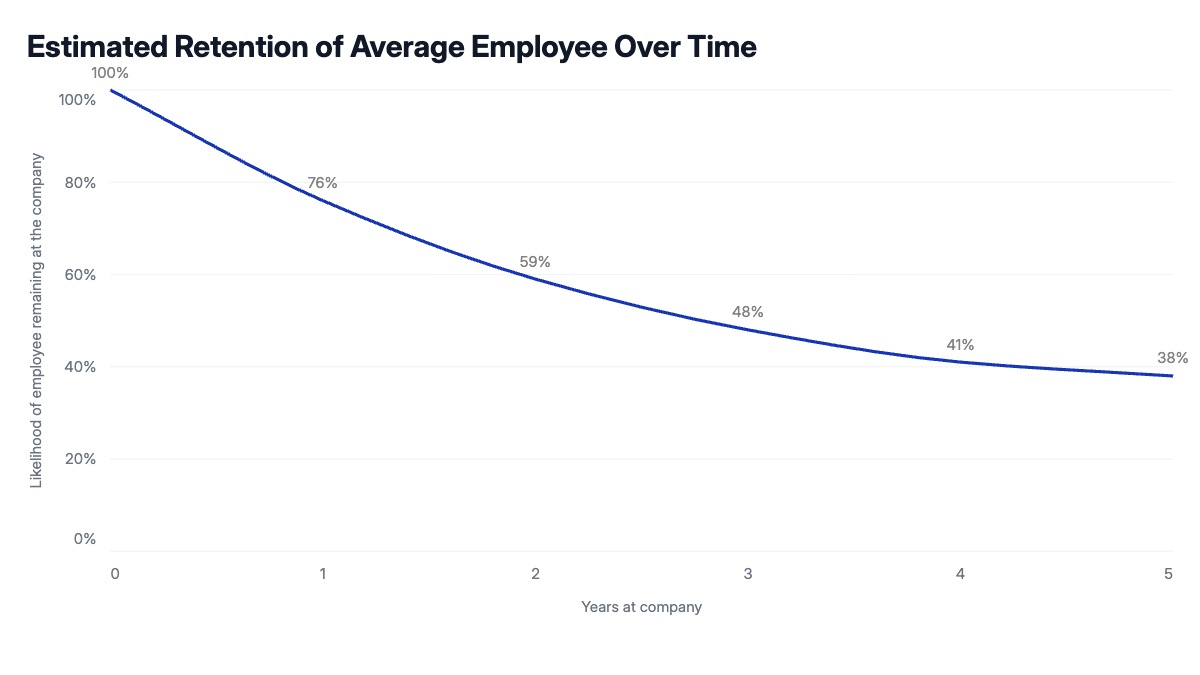
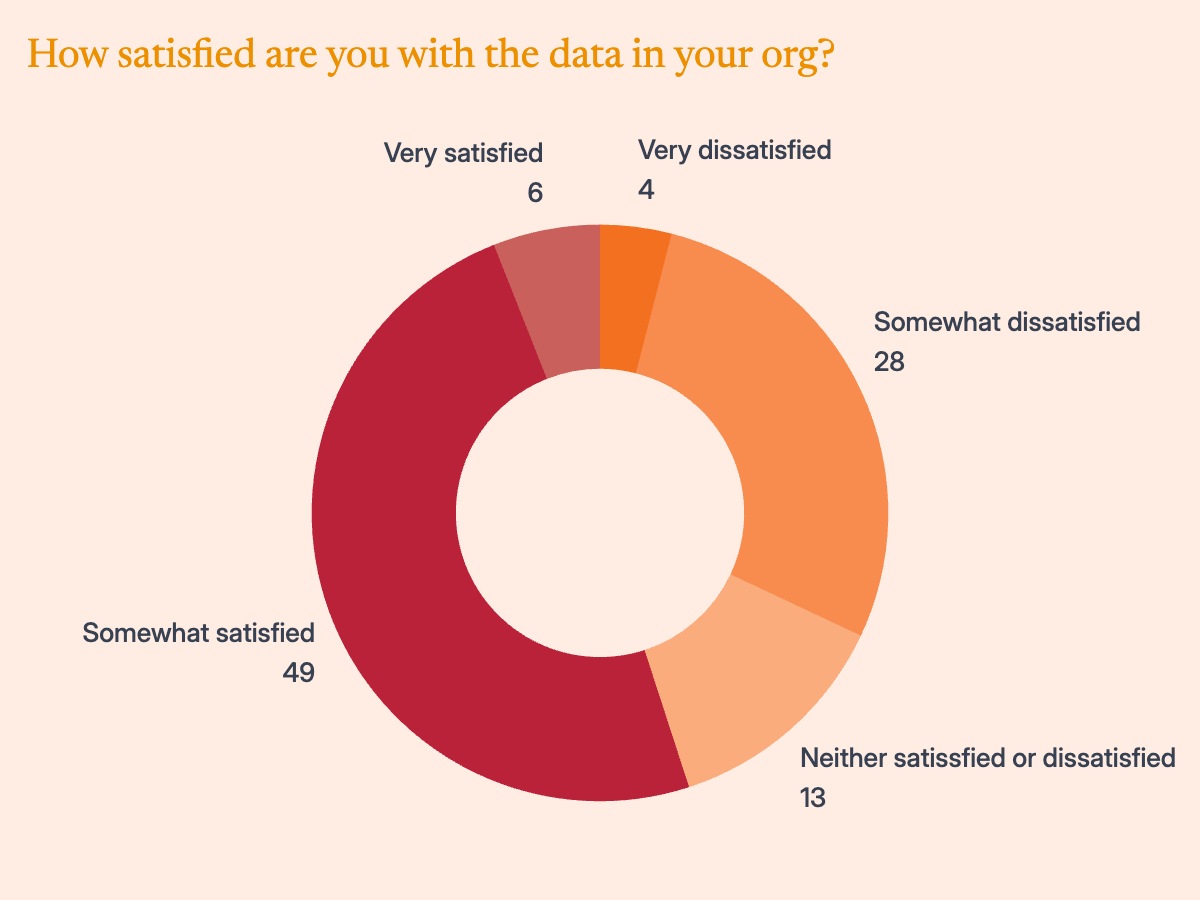
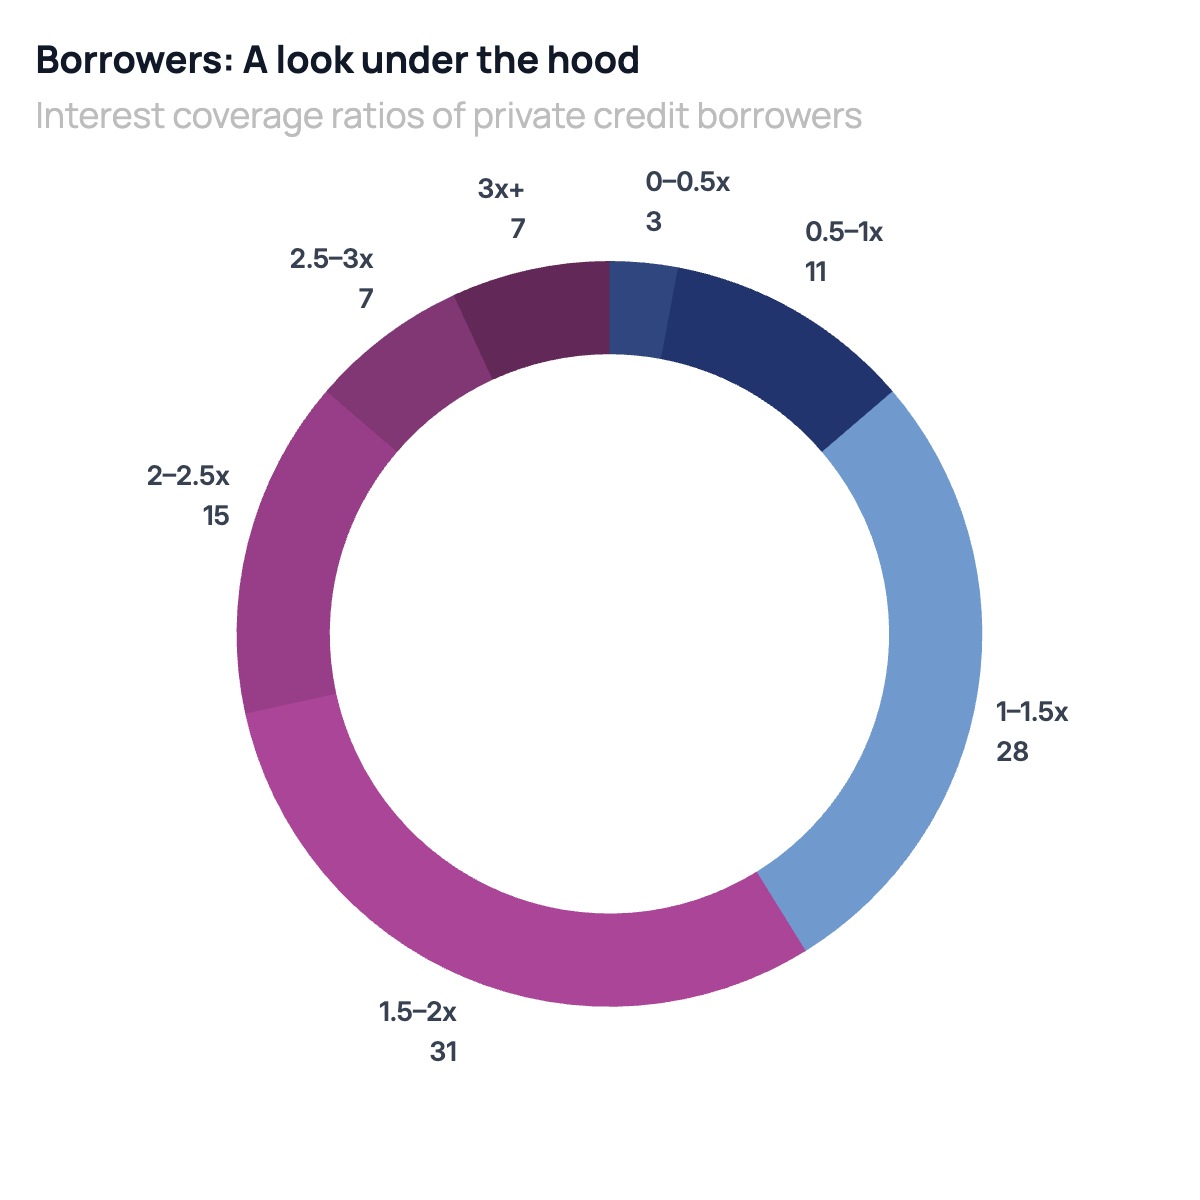
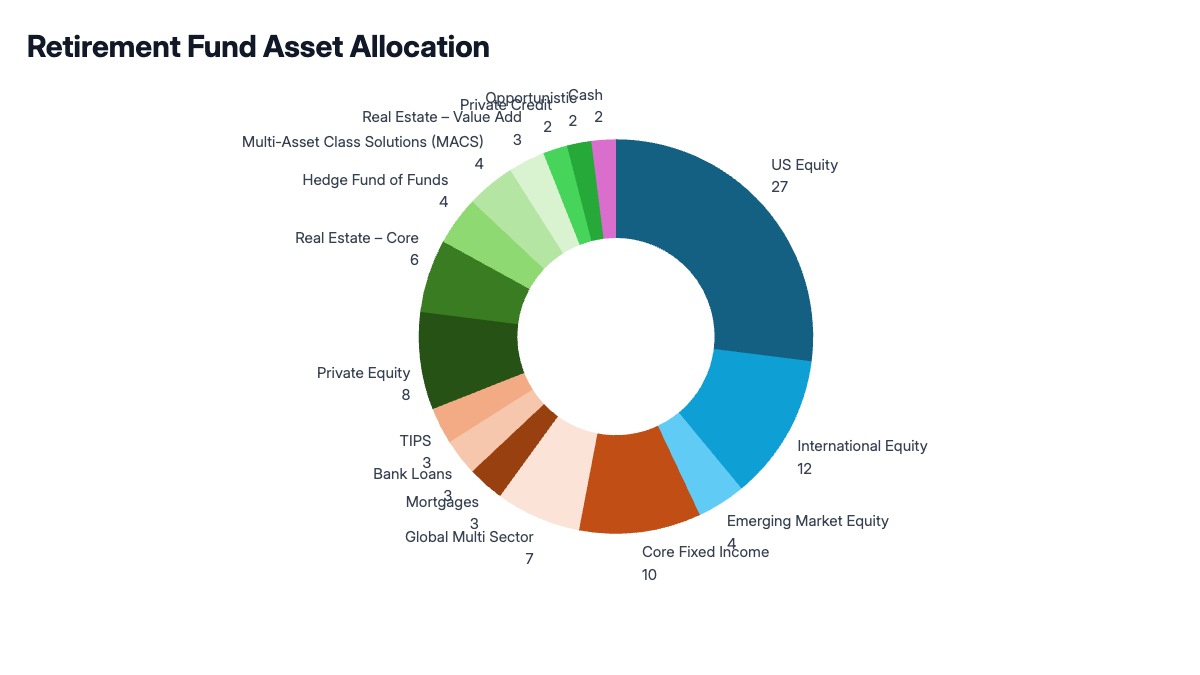
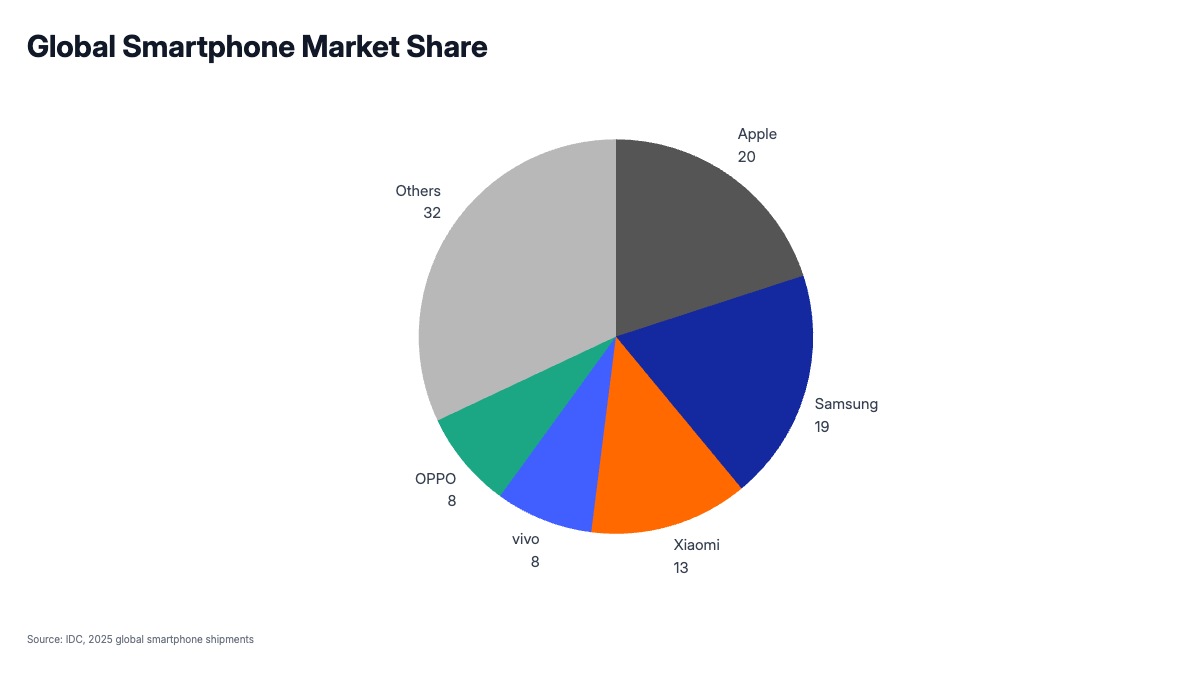

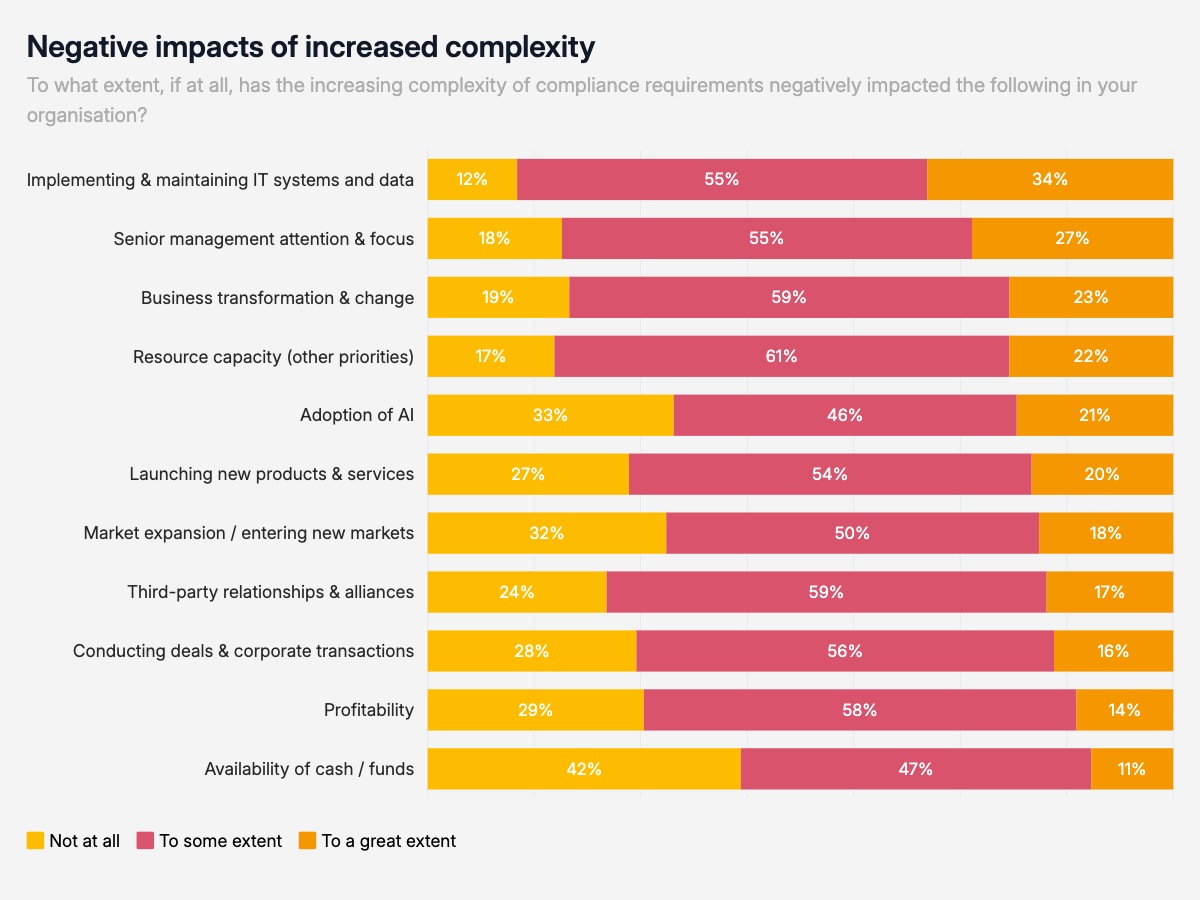
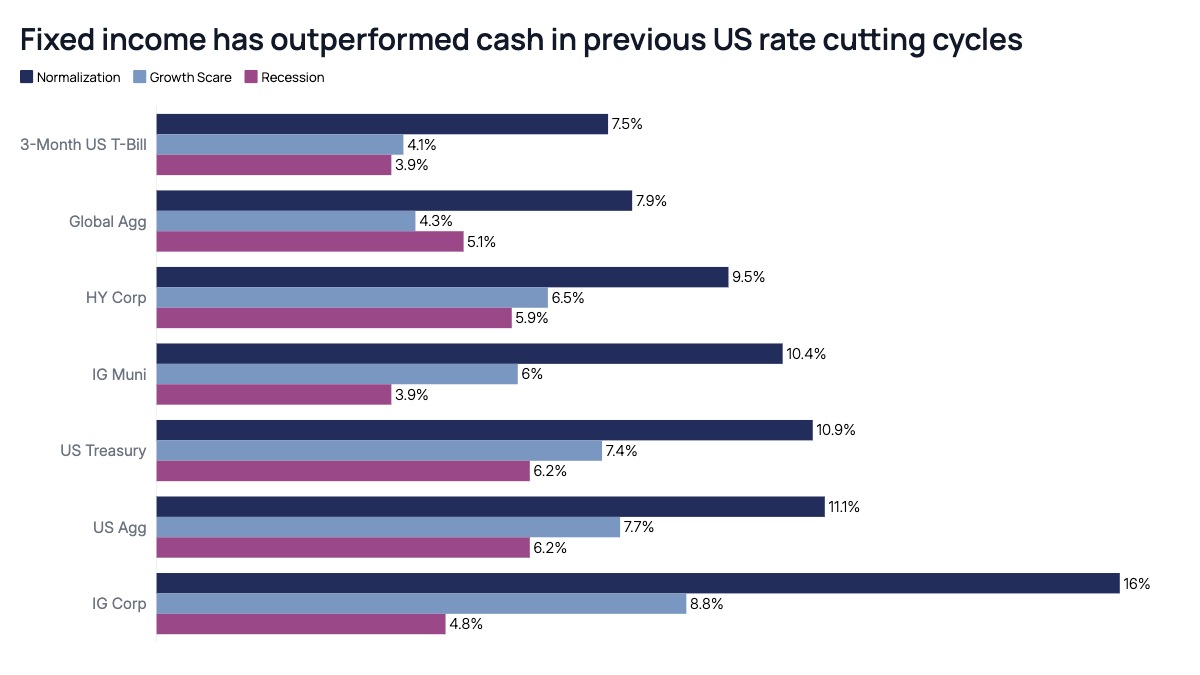

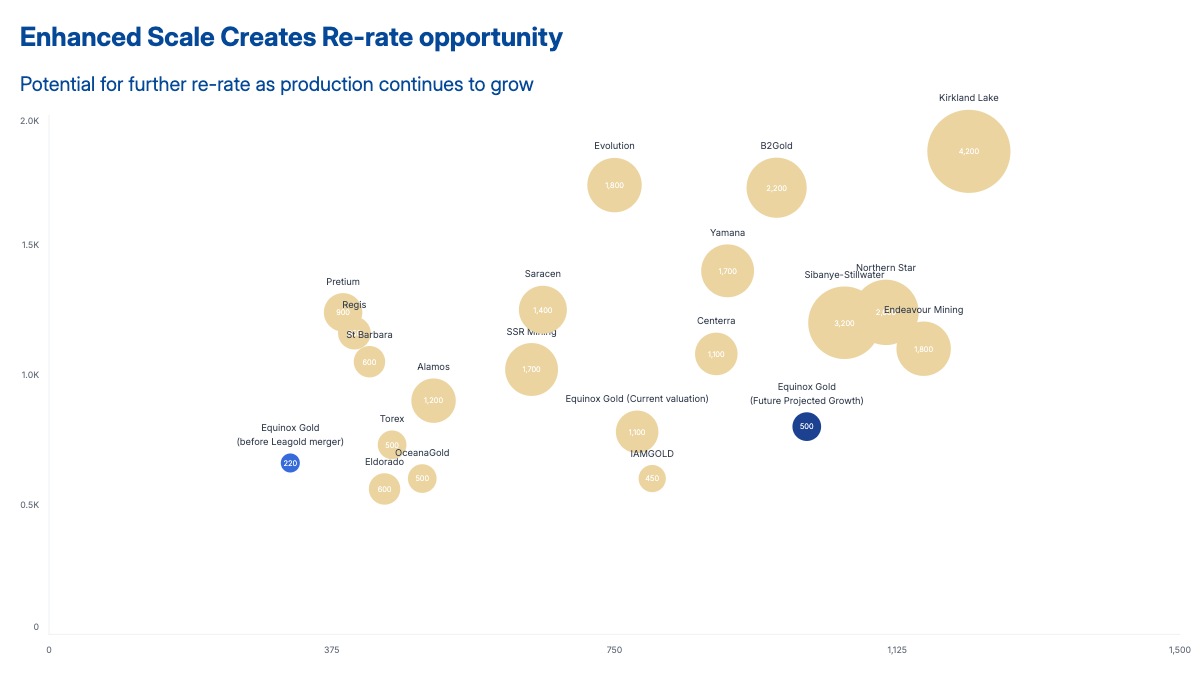
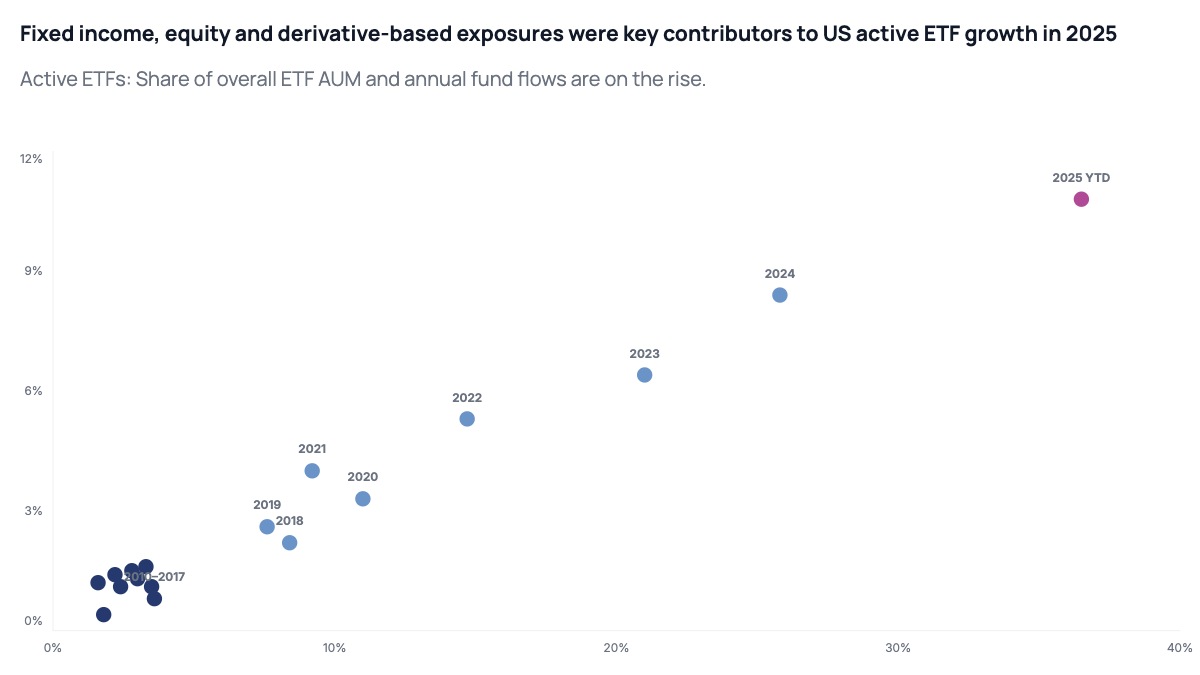
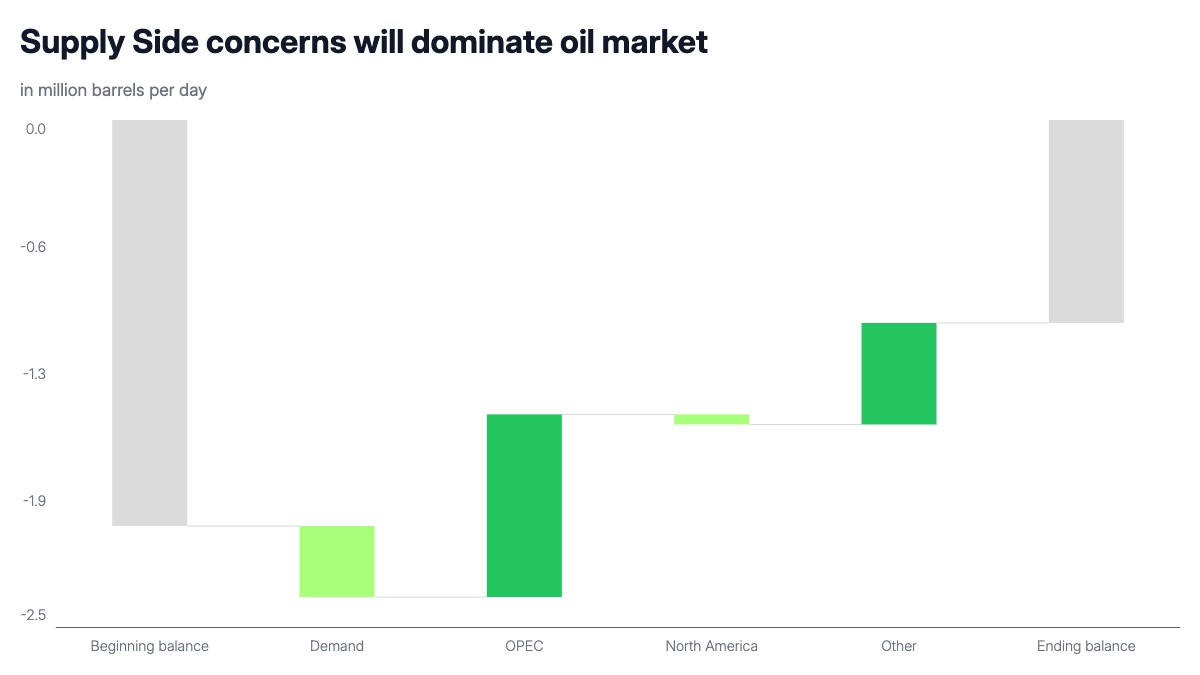
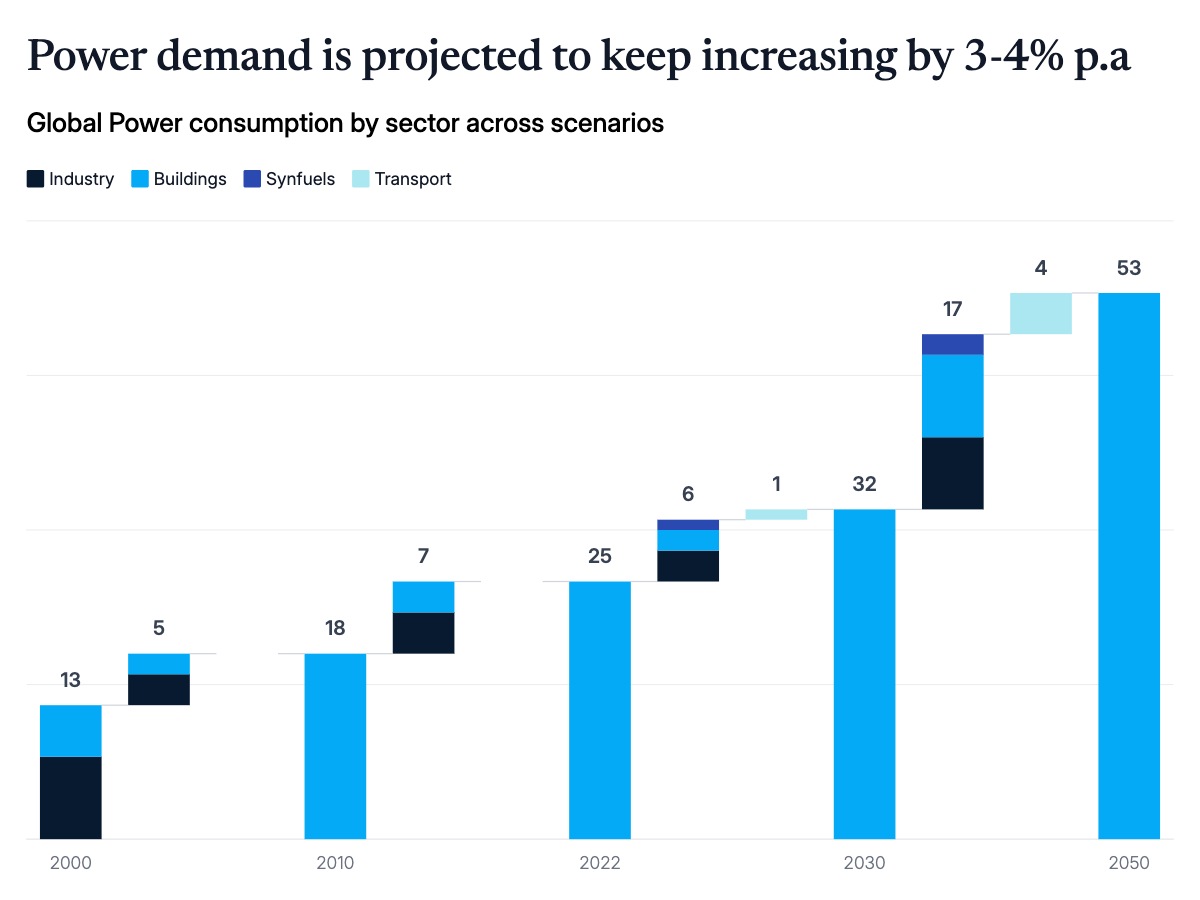
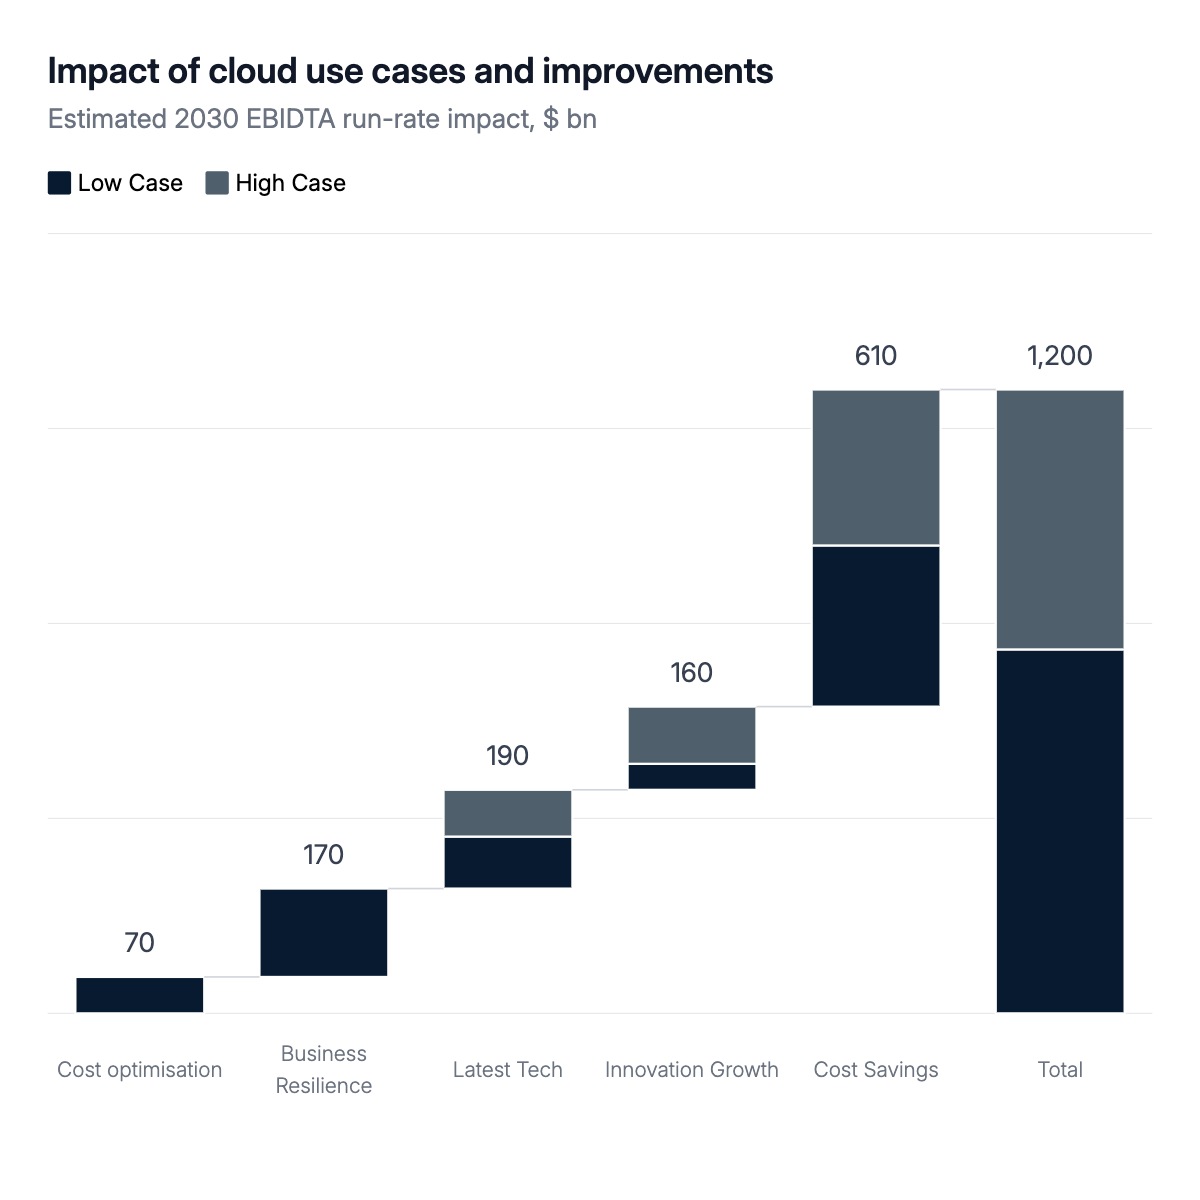
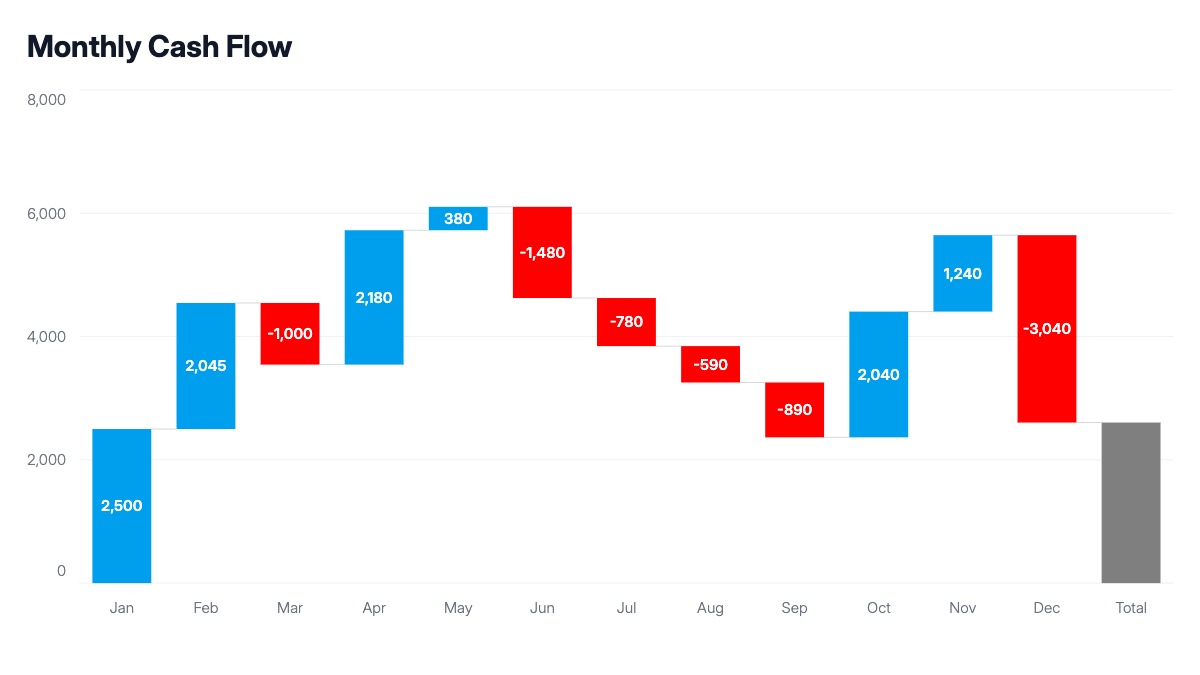
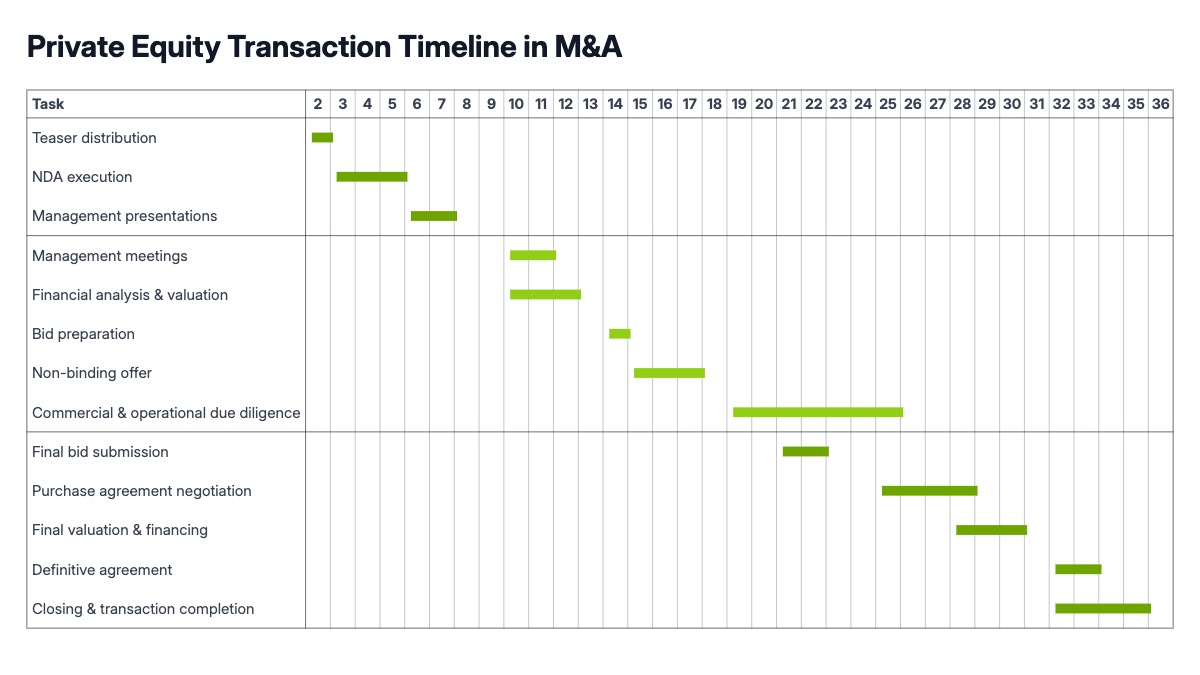
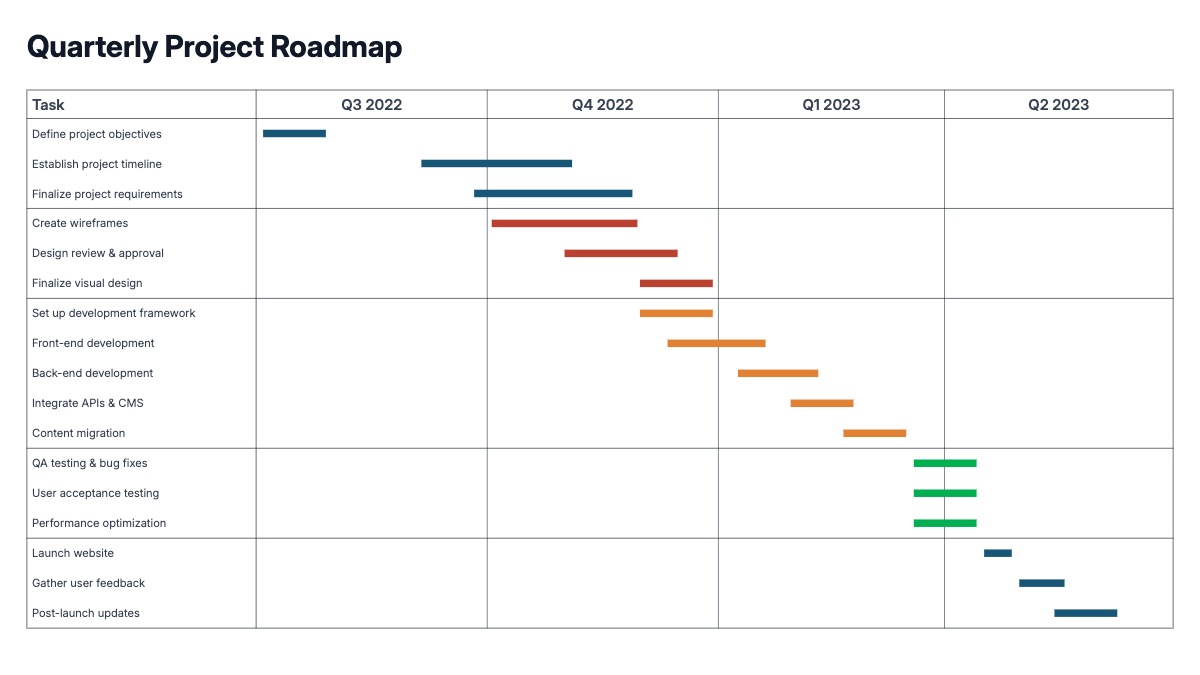
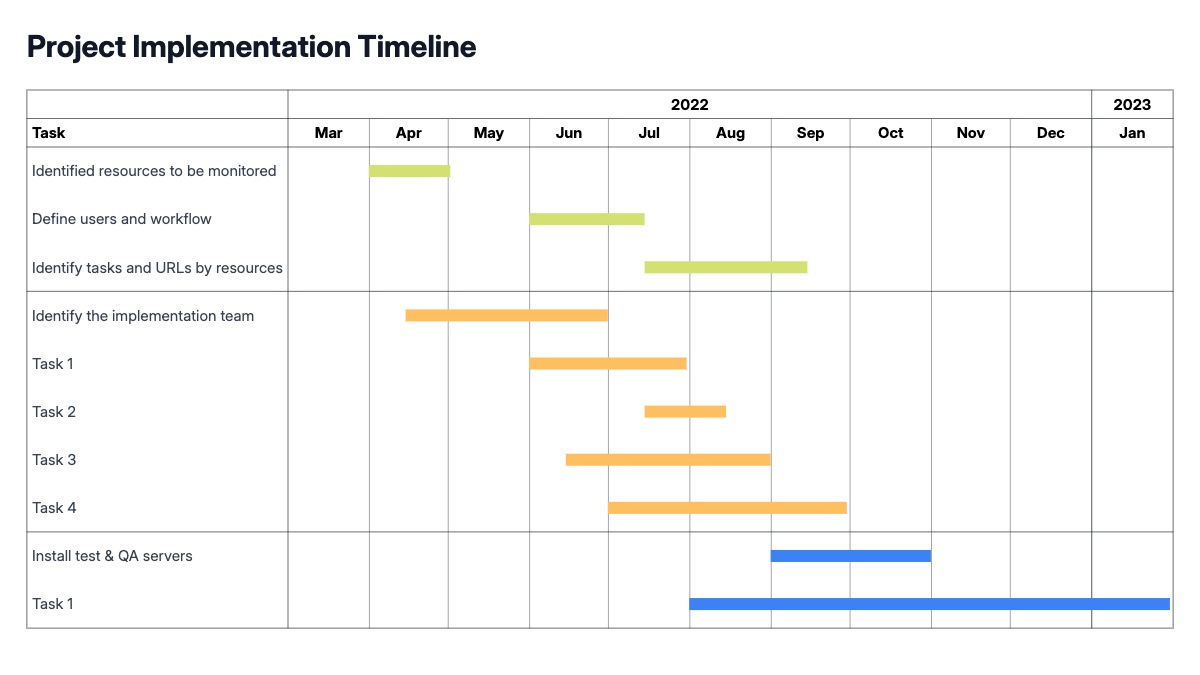
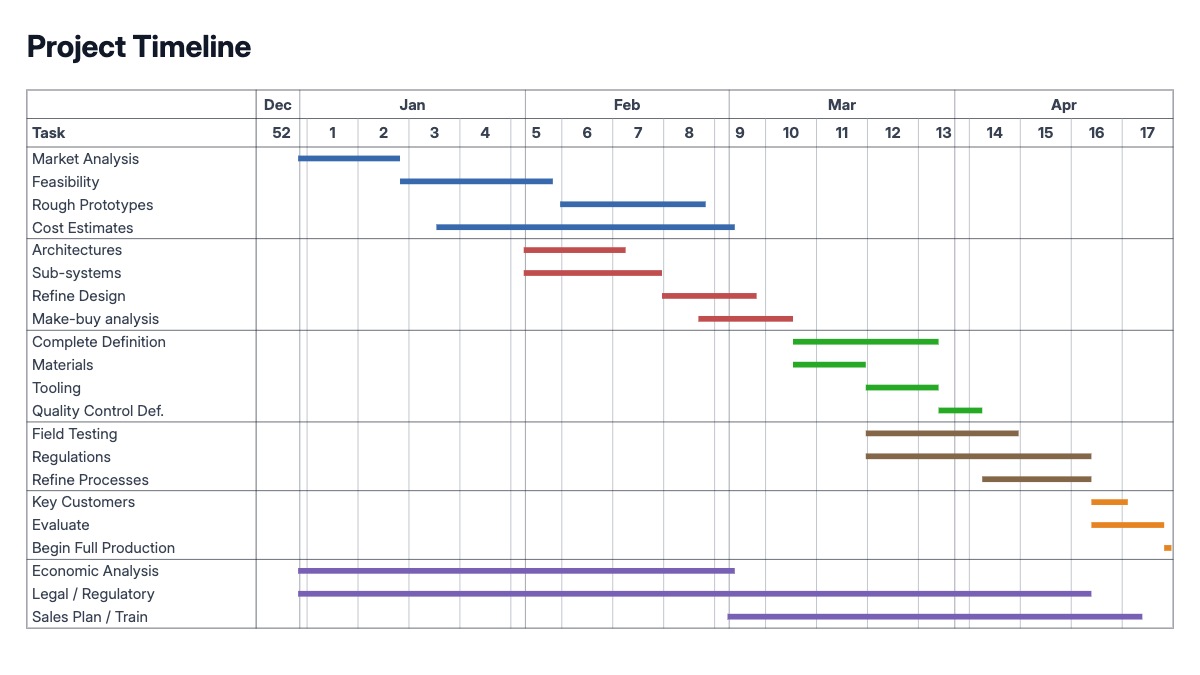
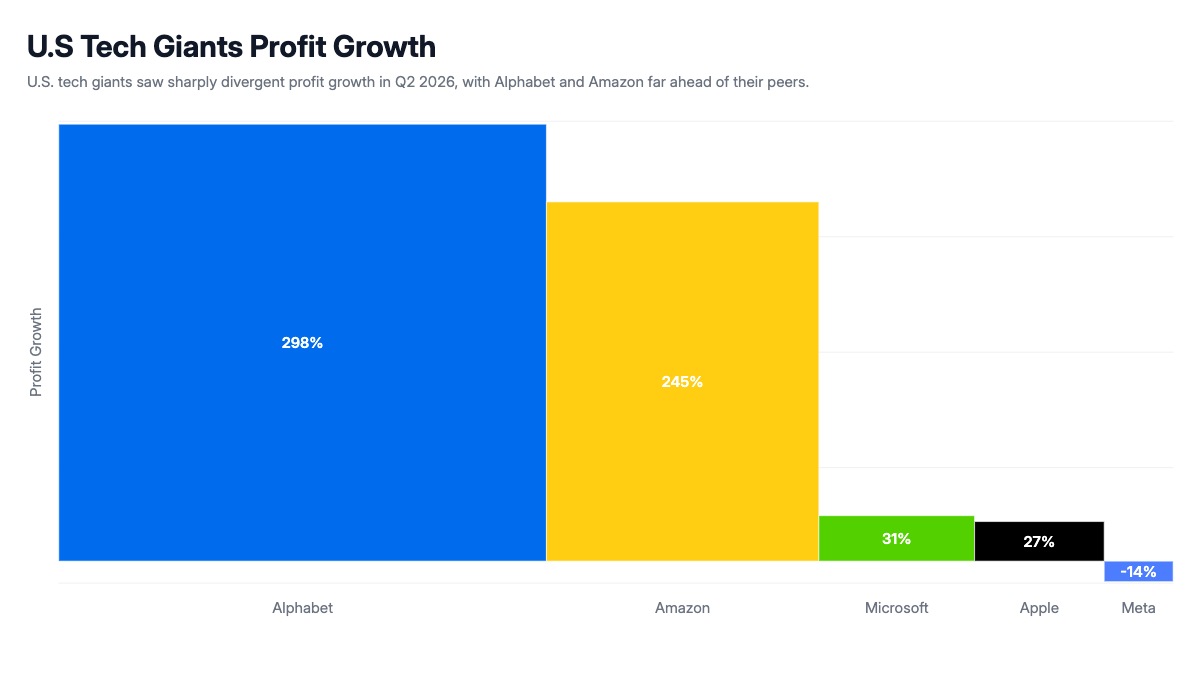
Chart templates for the charts PowerPoint can't build
PowerPoint and Google Slides handle basic bar, line, and pie charts fine. Waterfall bridges, funnel charts, treemaps, and scatter plots are a different story: they require workarounds or expensive add-ins. AECharts has ready-to-use templates for all of them. Pick a template, paste your data, and drop the finished chart into your deck.
What chart types are included in the template library?
The template library includes column charts (clustered, stacked, 100% stacked), horizontal bar charts, line and area charts, pie and donut charts, waterfall and stacked waterfall charts, Mekko and Bar Mekko charts, Gantt charts, funnel charts, scatter and bubble plots, treemaps, heatmaps, waffle charts, gauge charts, bar chart races, line races, and animated number templates.
Can I use my own data in these chart templates?
Yes. You can paste your own data directly into AECharts or import from a spreadsheet. Templates are only the starting point: the labels, values, colors, titles, and formatting can all be changed to match your dataset.
Can I export charts to PowerPoint?
Yes. Every chart template drops directly into PowerPoint and Google Slides. A static image export is also available for reports and one-off slides.
Do I need design skills to use these templates?
No. Templates are built so you can start with a polished chart and adjust it quickly. No design software or coding knowledge required.
Which chart types does PowerPoint not support natively?
PowerPoint doesn't have native waterfall (bridge) charts, funnel charts with proportional segments, treemaps, Mekko charts, dumbbell plots, or bar chart races. AECharts has templates for all of these.
Browse individual templates