Quarterly Project Roadmap
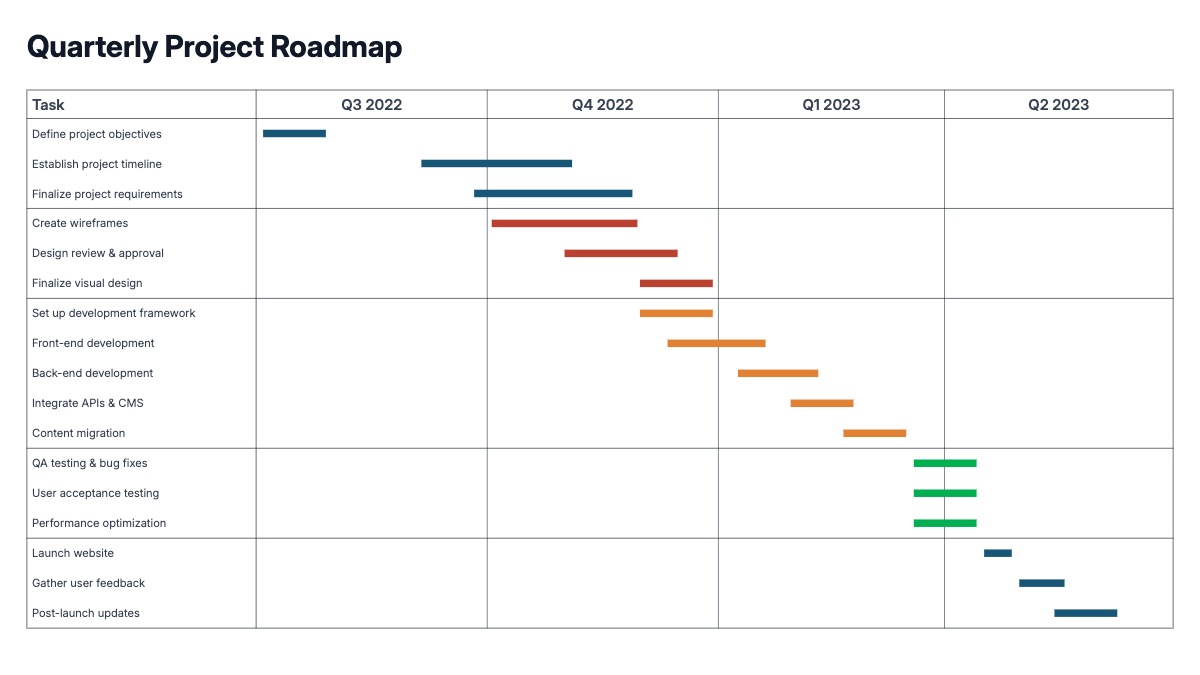
A quarterly roadmap is the bar-per-initiative chart teams present when leadership wants to see what's shipping and when, without opening a project tracker. Each row is a workstream or initiative, and the bar spans the quarters it runs across, Q1 through Q4. A vertical line marks the current quarter so readers immediately see what's already shipped versus what's still ahead. There are no assignees, no percent-complete fills, no dependency arrows connecting rows, the roadmap slide is a communication tool, not a working project plan, and it stays legible because it leaves that detail out.
This is the roadmap slide in a board deck, the initiative overview in a quarterly business review, or the "here's what we're building" slide in an all-hands. Product and engineering leaders use it to show a portfolio of initiatives at a glance rather than walking through a backlog. Founders use it in investor updates to show progress against a plan stated a quarter earlier. The same structure works for marketing campaign calendars, hiring plans, or any set of initiatives that run across a shared quarterly timeline.
Six to ten rows is the practical range before the chart needs to shrink font size to fit. Group and color rows by team or theme so a reader can scan for a function, product, growth, platform, without reading every label. Keep initiative names to a few words since they sit beside the bar, not in a separate table. All rows, quarter ranges, colors, and labels are editable in the chart editor, and the finished roadmap can be dropped straight into a PowerPoint or Google Slides deck.