Project Timeline
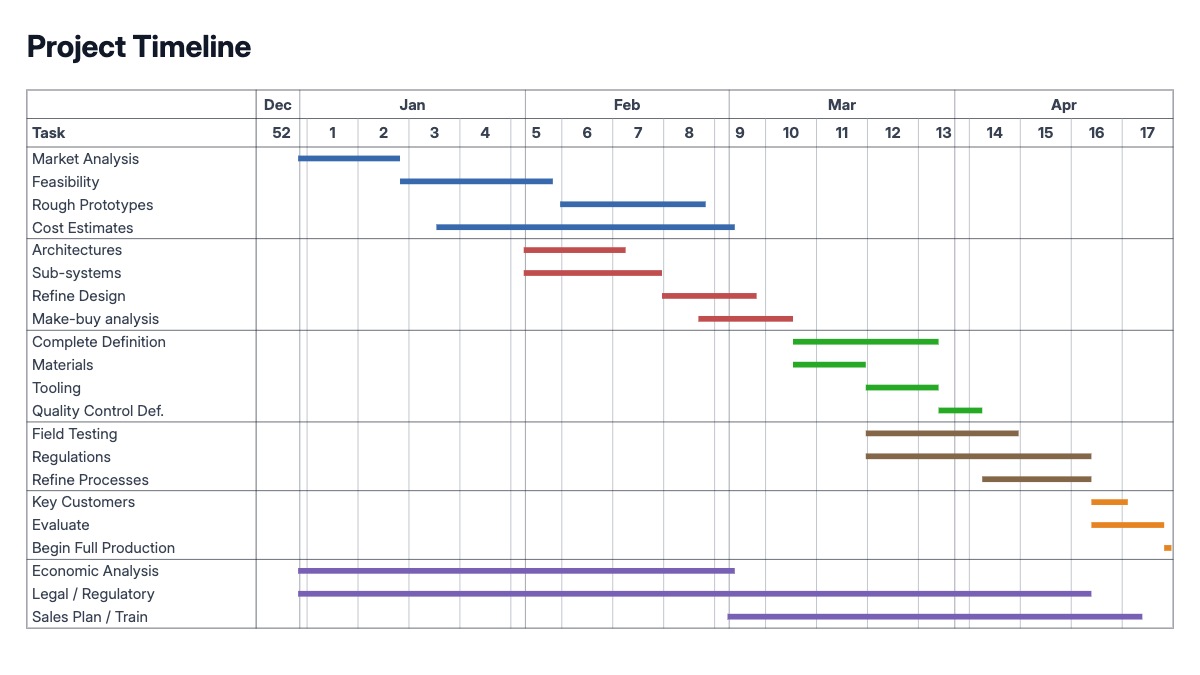
A project timeline is the plainest version of a Gantt chart, the one most people picture when they hear the term: a handful of phase bars running left to right across a calendar axis, with milestone diamonds marking the dates that matter. Planning, Execution, Review, and Delivery is a common four-phase structure, but the phases can be renamed to fit any project. There are no assignees, no dependency lines, no percent-complete shading, this is the slide version of a plan, built to be understood in the few seconds a reader spends on it, not the working plan a team manages day to day in a separate tool.
This is the timeline slide in a project kickoff deck, a client-facing status update, or a proposal where a reader needs to see the shape of a project before agreeing to it. It works as a generic starting point for almost any project-based business, agencies, consultancies, internal initiatives, event planning, without needing a specialized version like a deal timeline or an implementation plan. Anyone who needs to answer "what happens, and by when" in a single slide reaches for this format.
Three to six phases is enough to show shape without clutter. Use milestone markers sparingly, two or three per timeline, so each one still reads as significant. Keep phase bars roughly proportional to their real duration so the timeline reads honestly rather than as evenly spaced placeholders. All phase names, dates, milestone labels, and colors are editable in the chart editor, and the finished timeline can be dropped straight into a PowerPoint or Google Slides deck.