Private Equity Transaction Timeline
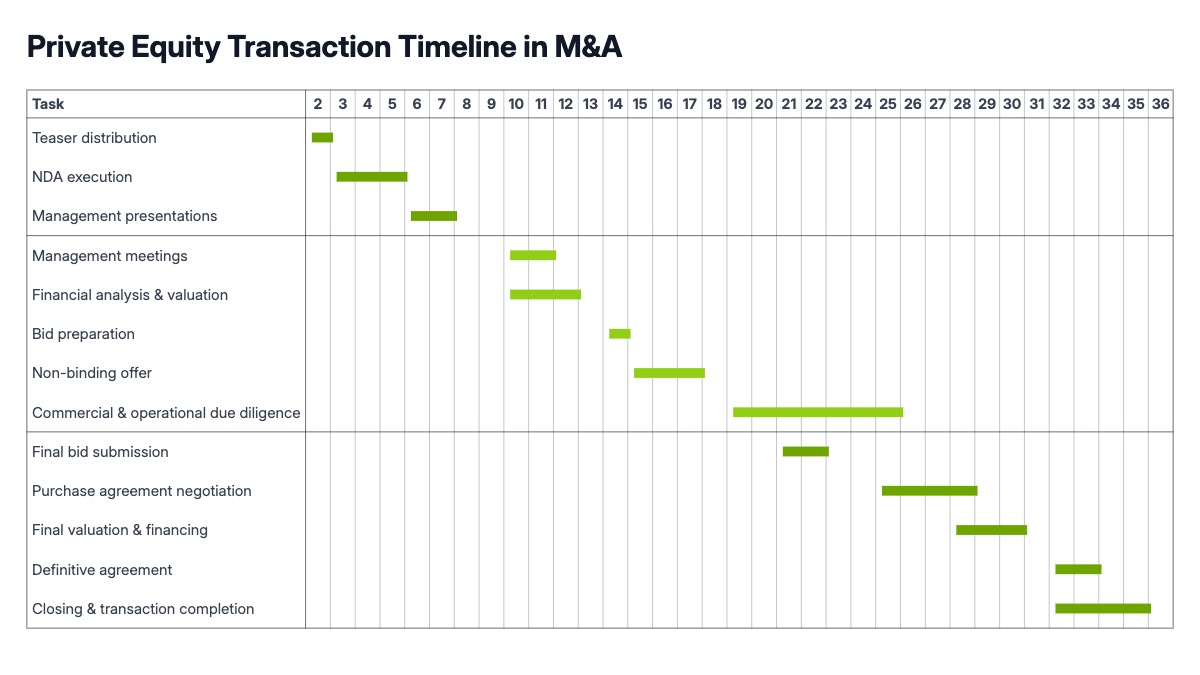
A private equity transaction timeline is the horizontal bar chart every deal team draws by hand in PowerPoint, then redraws again the next time dates slip. Each bar is a phase of the transaction, Preparation, Marketing, Due Diligence, Negotiation, Signing, Closing, and Integration, positioned along a week or month axis. Diamond markers mark the two dates that matter most to a reader flipping through a CIM or IC memo: signing and close. Unlike a project-tracking Gantt chart with assignees, dependencies, and percent-complete bars, this version stays reduced to what a deal timeline slide actually needs to communicate, how long each phase runs and when the transaction is expected to close.
This chart appears in confidential information memoranda, investment committee decks, and lender presentations wherever a deal team needs to set expectations on pace. Bankers use it to show a seller how long a sale process typically takes from engagement to close. PE associates use it in IC memos to lay out the path from LOI to funding. Deal teams also reuse the same structure post-signing to track the 100-day integration plan, swapping the deal phases for integration workstreams without changing the underlying format.
Five to eight phases is the practical range, more and the bars become too thin to label inside the chart area. Keep phase names short, two or three words, since they sit directly on or beside each bar rather than in a legend. Color the pre-signing and post-signing phases differently so the reader can see at a glance how much of the timeline is negotiation versus integration. All phase names, dates, milestone labels, and colors are editable in the chart editor, and the finished timeline can be dropped straight into a PowerPoint or Google Slides deck.