Implementation Timeline
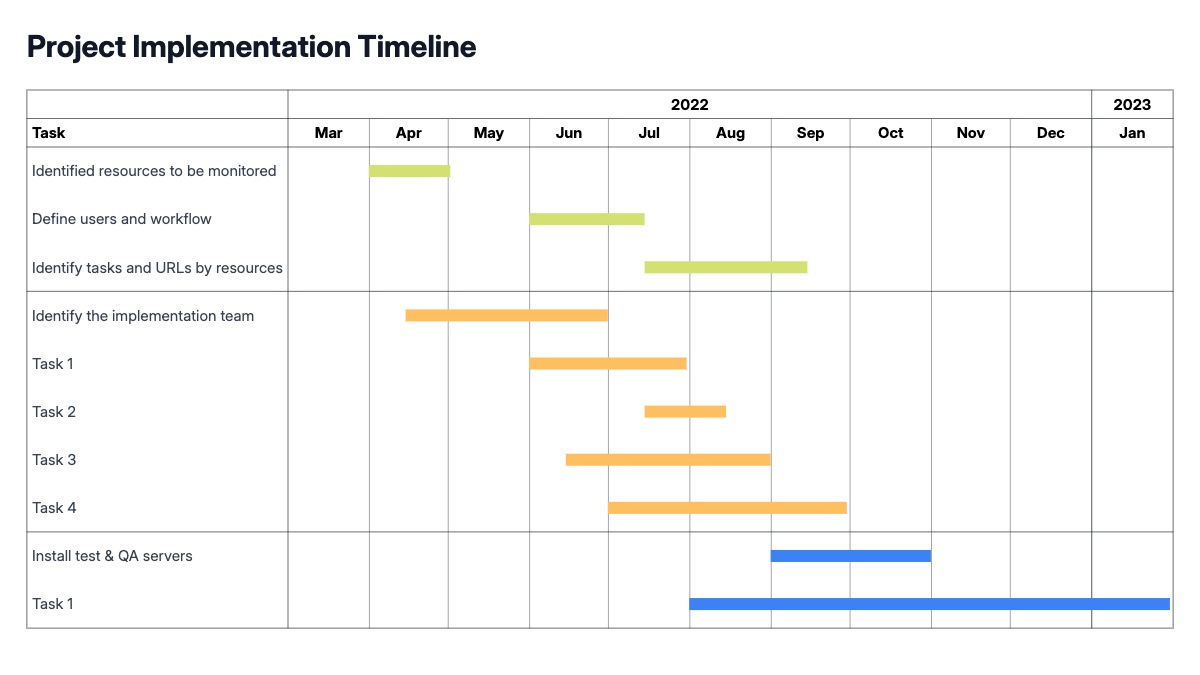
An implementation timeline is the slide a vendor or consulting team shows a client before a project starts, to set expectations on how long onboarding takes and what happens in each phase. Bars run left to right across Discovery, Configuration, Testing or UAT, Go-live, and Hypercare, with a milestone marker on the go-live date, the one date every stakeholder in the room actually cares about. Unlike an internal IT rollout tracker with task-level detail and owners per ticket, this version stays at the phase level, exactly the resolution a client-facing slide needs and no more.
This chart shows up in sales proposals, statements of work, and kickoff decks, wherever a vendor needs to answer "how long will this take" before the contract is signed. Customer success and professional services teams use it to align a new client on the plan in the first kickoff call. Sales teams include it in the proposal itself, since a concrete timeline is often what turns a verbal interest into a signed deal. Internal IT and ops teams reuse the same format for system migrations and rollouts, swapping vendor-facing phase names for internal ones.
Four to six phases keeps the chart readable without crowding the go-live milestone. Use a distinct color or marker for go-live so it reads as the milestone it is, not just another phase boundary. Hypercare or post-launch support should visually read as lighter or shorter than the build phases, it is a wind-down, not another full phase. All phase names, dates, milestone labels, and colors are editable in the chart editor, and the finished timeline can be dropped straight into a PowerPoint or Google Slides deck.