Chart Maker for Management Consultants
AECharts builds the chart types consulting decks need, directly in the browser: waterfall bridges, Mekko share breakdowns, Gantt workplans, and the profitability and benchmarking charts that round out a client deck.
How it works
- Choose a chart type. Waterfall, Mekko, Gantt, and more.
- Add data or describe the chart. Paste from Excel, Google Sheets, or CSV, or use an AI prompt to create a first draft.
- Customize and download. Edit labels, colors, fonts, and axes, then drop into PowerPoint or Google Slides.
Chart types built for consulting decks
From bridge charts to benchmarking, the chart types that show up across a consulting engagement.
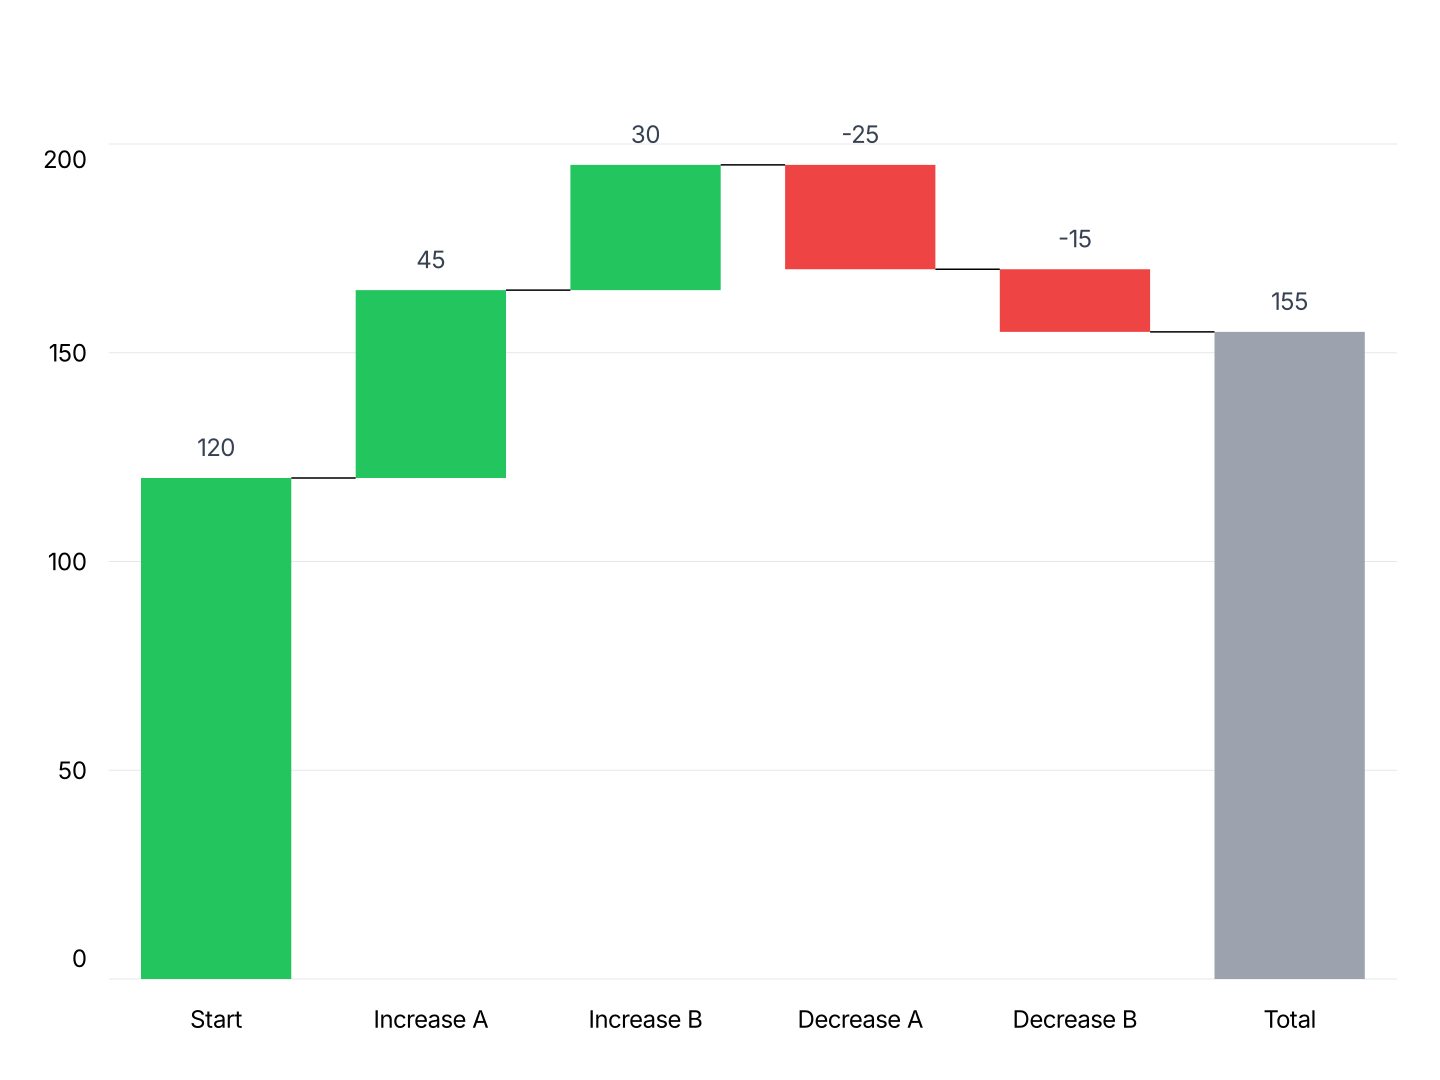
- Waterfall: P&L bridges and cost breakdowns. Decomposes a total into the components that drove it.
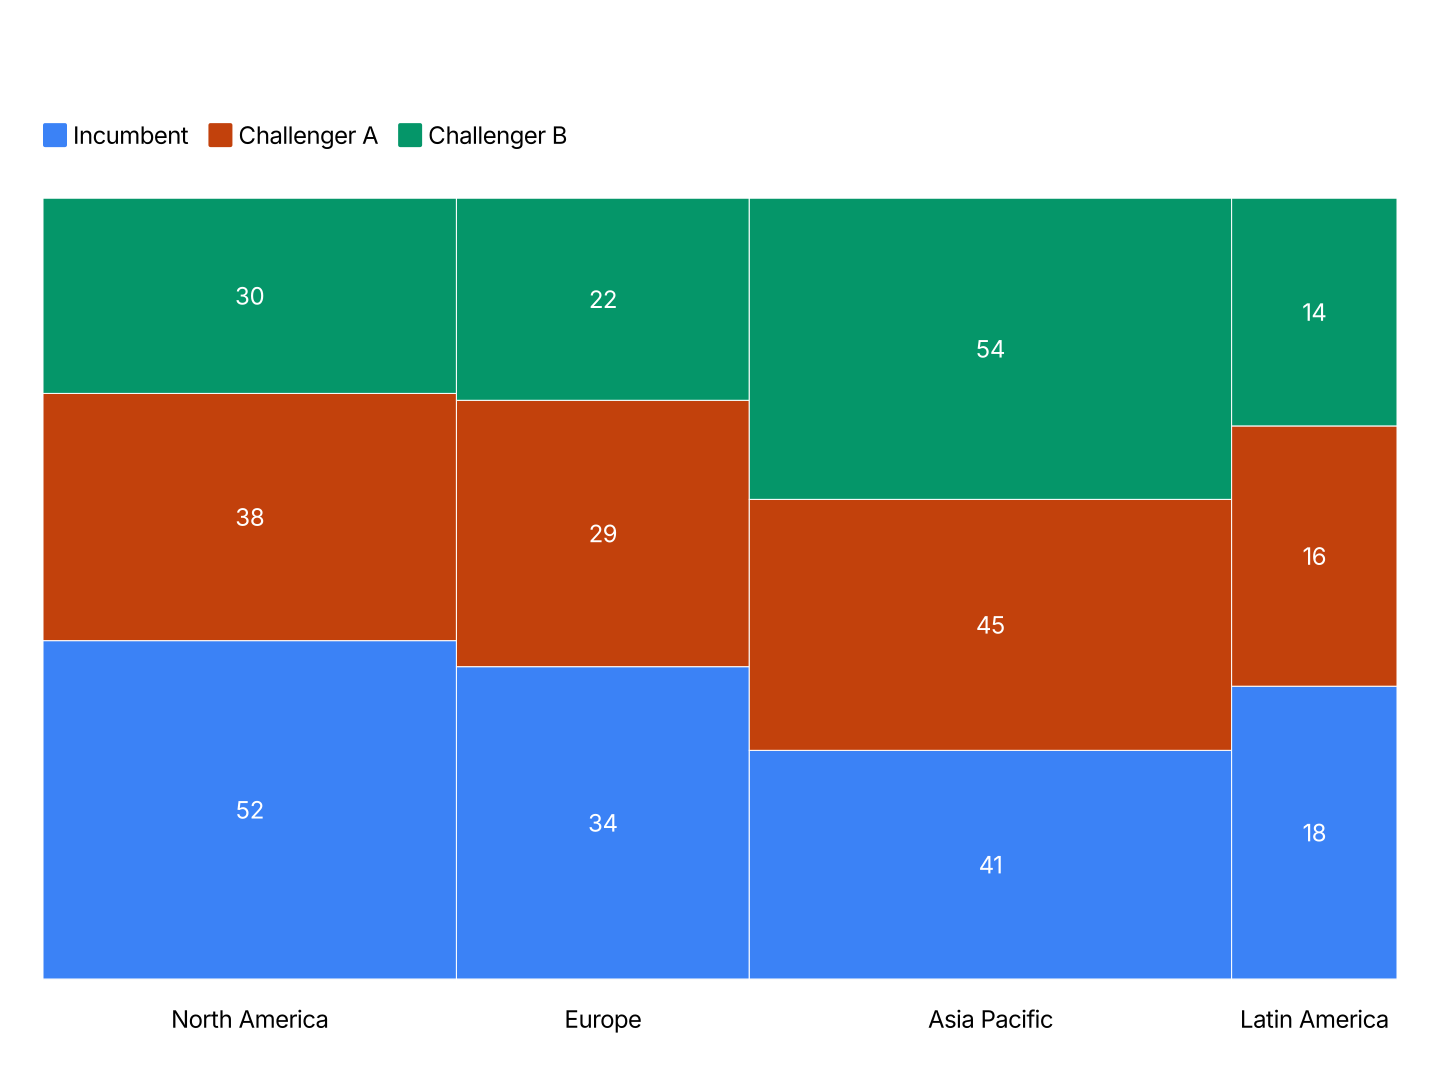
- Mekko: Market landscape and competitive positioning. Column width shows market size, stacked height shows share. Standard in strategy consulting.
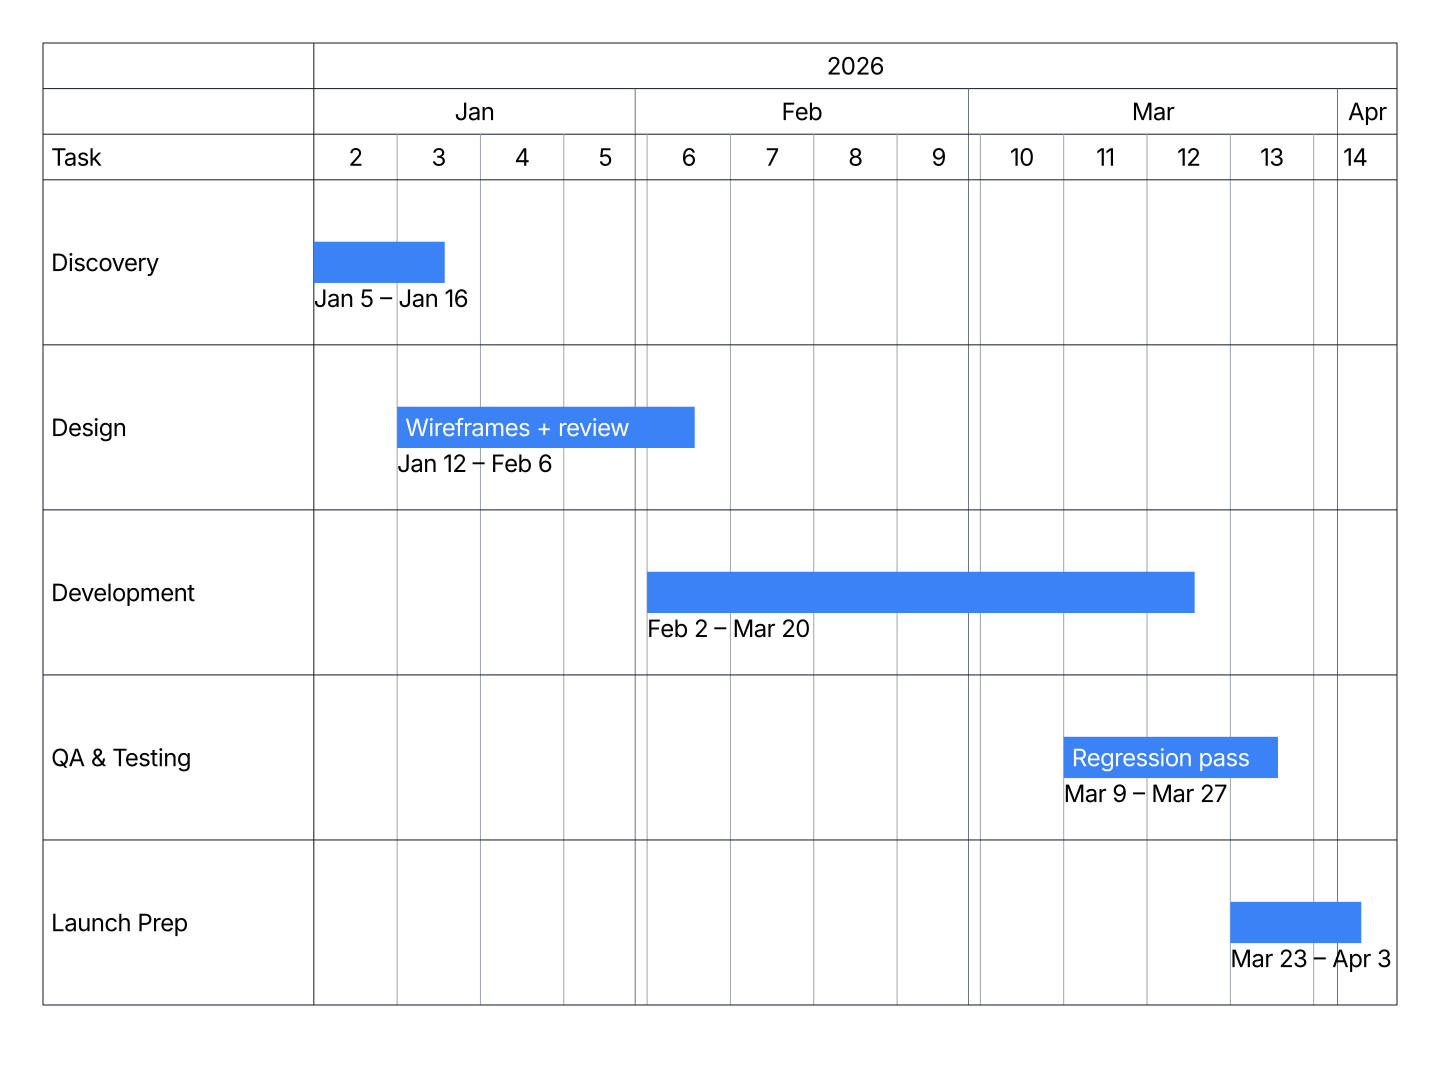
- Gantt: Engagement workplans and deal timelines for kickoff and status decks.
- Stacked Waterfall: Revenue bridges and EBITDA walks where each step breaks into sub-components.
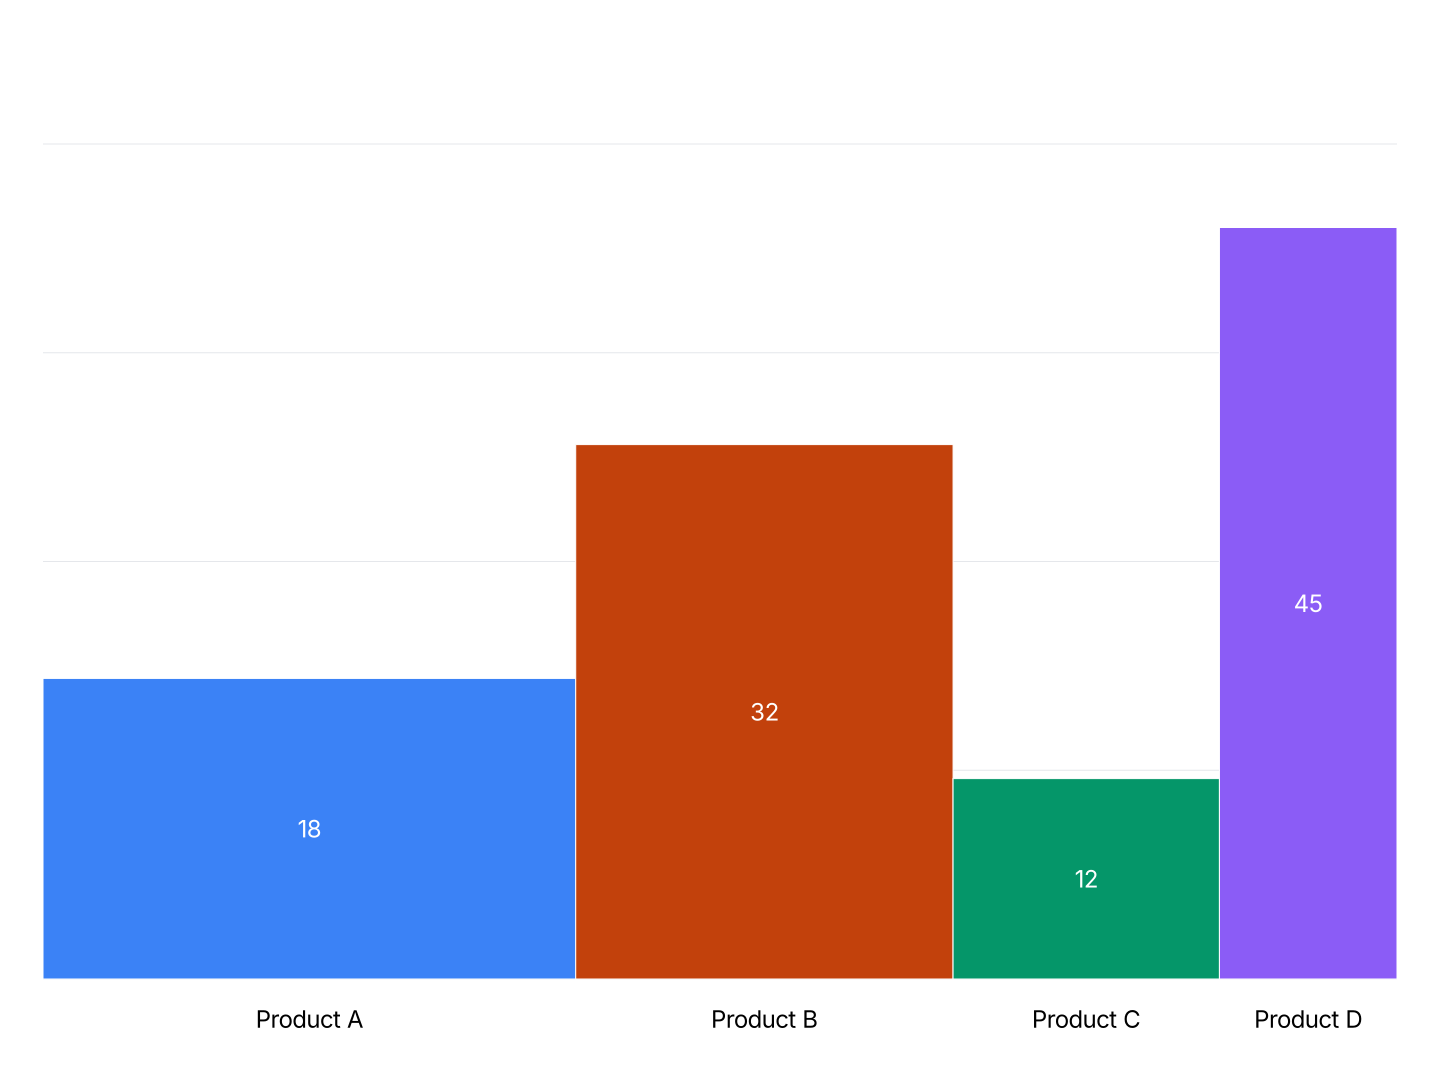
- Bar Mekko: Profit pool analysis and product or customer profitability. Width and height carry independent numbers.
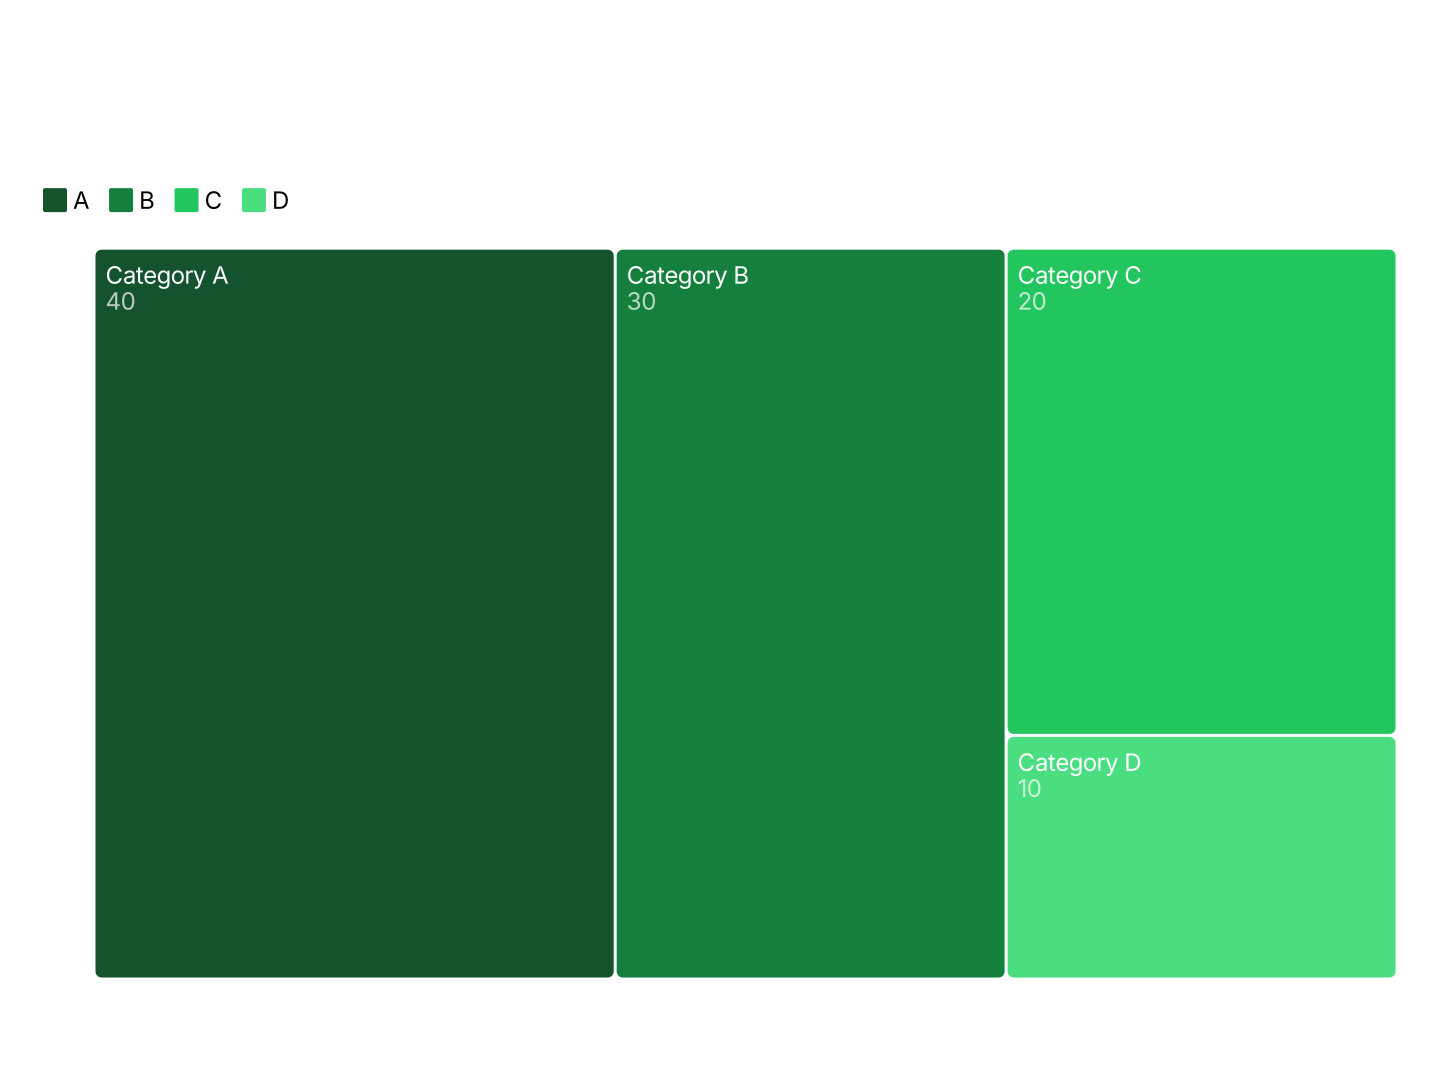
- Treemap: Portfolio composition and budget breakdowns across a two-level hierarchy.
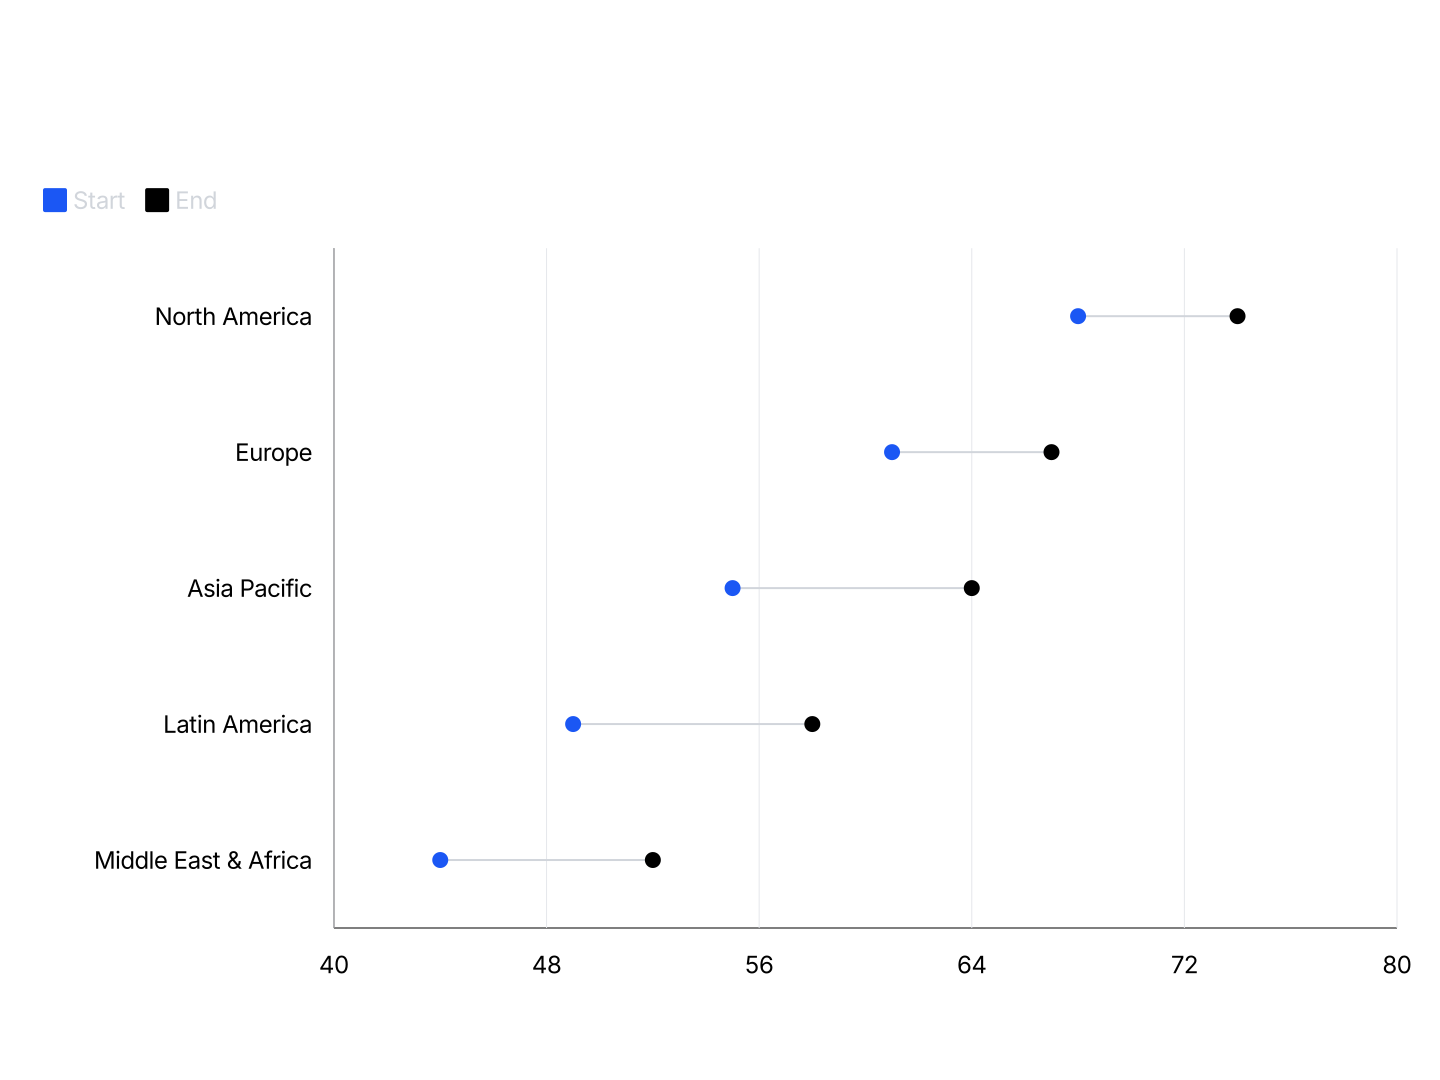
- Dumbbell: Benchmarking a client's metric against the industry average, category by category.
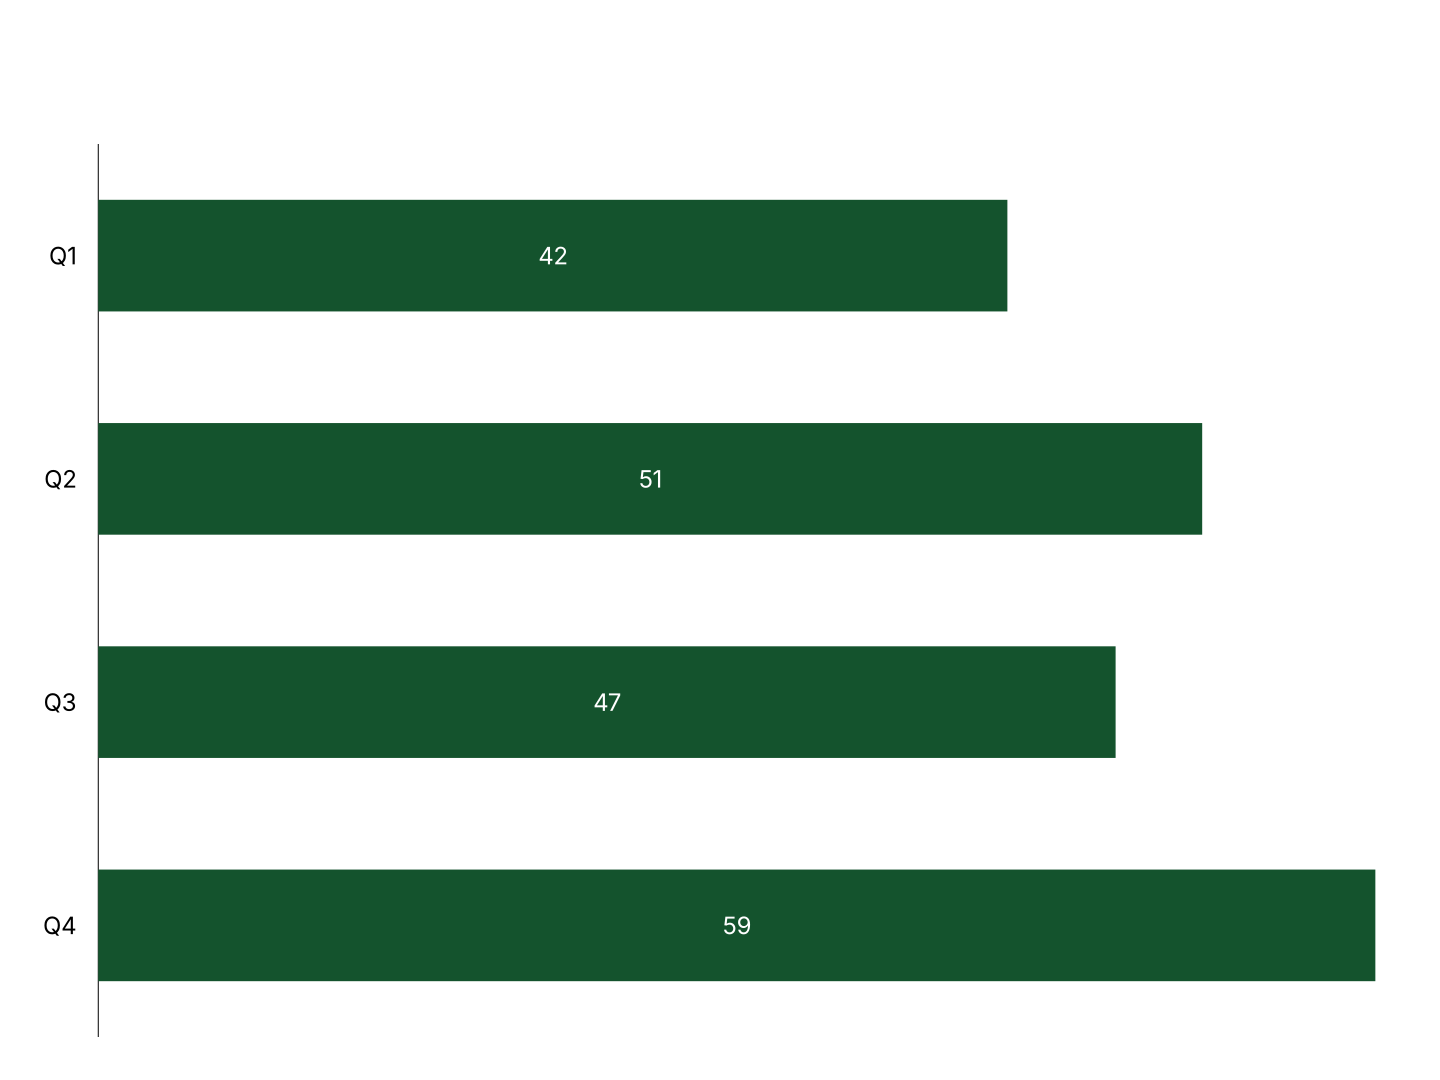
- Horizontal Bar: Competitive benchmarks and ranked comparisons with long category labels.
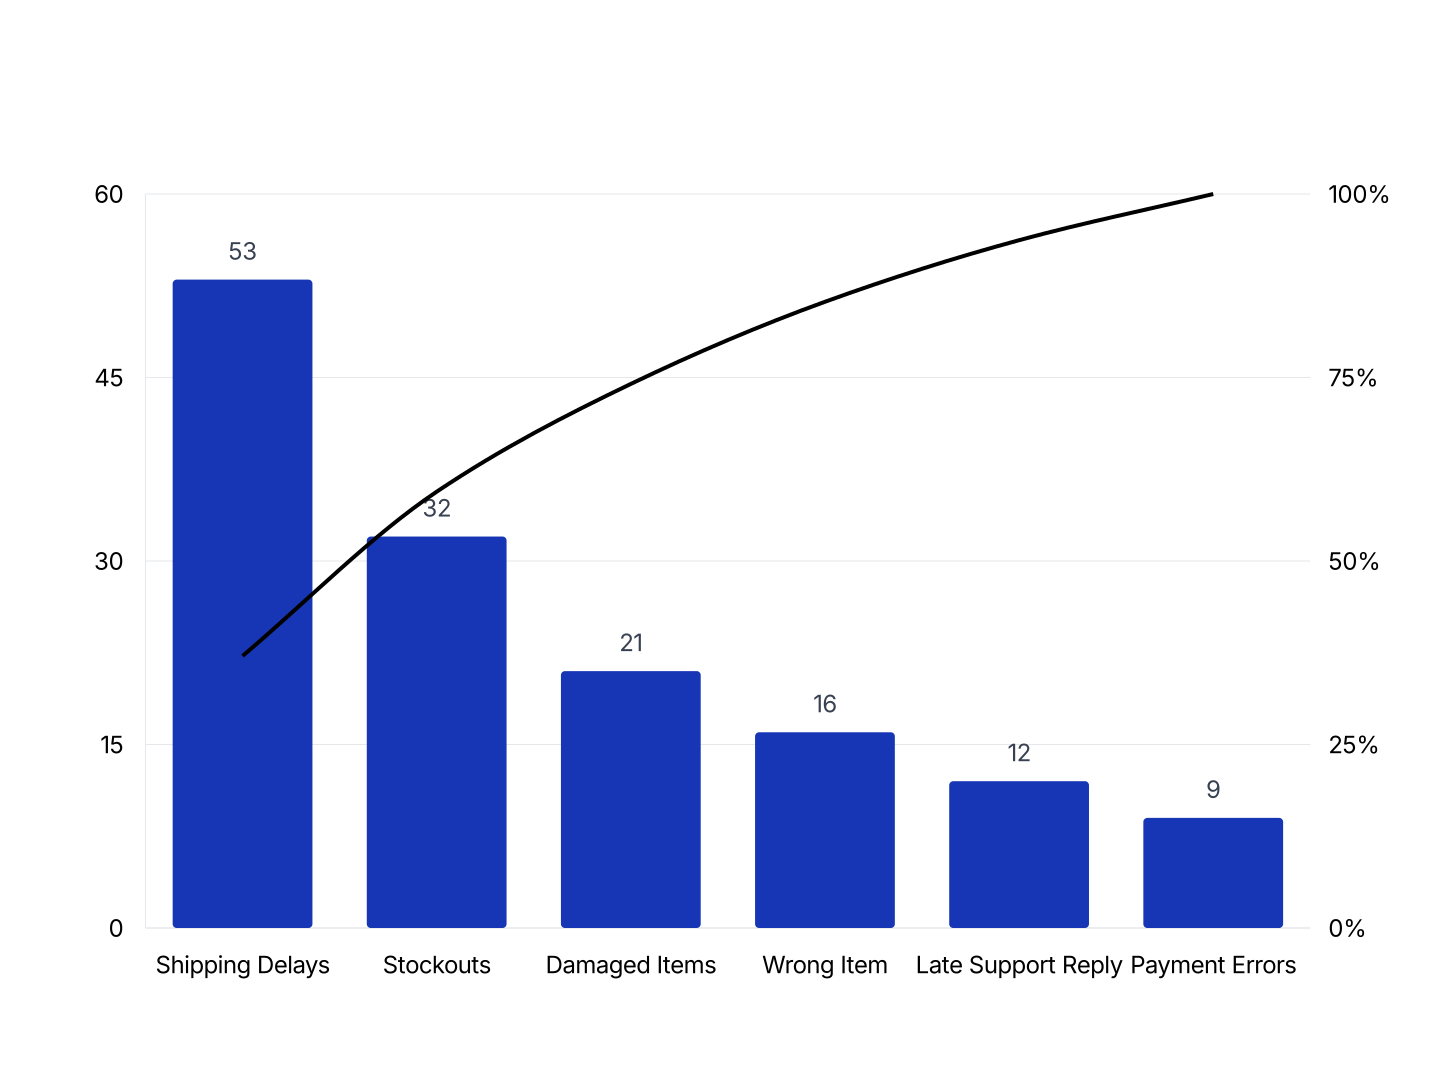
- Pareto: 80/20 prioritization. Ranks causes or categories by cumulative impact.
- Tornado: M&A models and budget assumption testing. Shows which variable moves a forecast most.
FAQ
Paste your data, pick a chart type, and drop it into PowerPoint or Google Slides.
Related