Bar Chart Template
Animated bar chart templates for comparisons, rankings, and category data. Pick a template below, paste your data, and export a clean 1080p animated video in seconds — no design skills required.
Every template is fully customisable: colours, fonts, bar spacing, axis labels, and animation speed. Apply a Brand Kit so every chart looks consistent across investor decks, reports, and social posts.
Bar chart examples
Real-world bar chart examples across finance, sales, e-commerce, and more. Use any as a starting point.
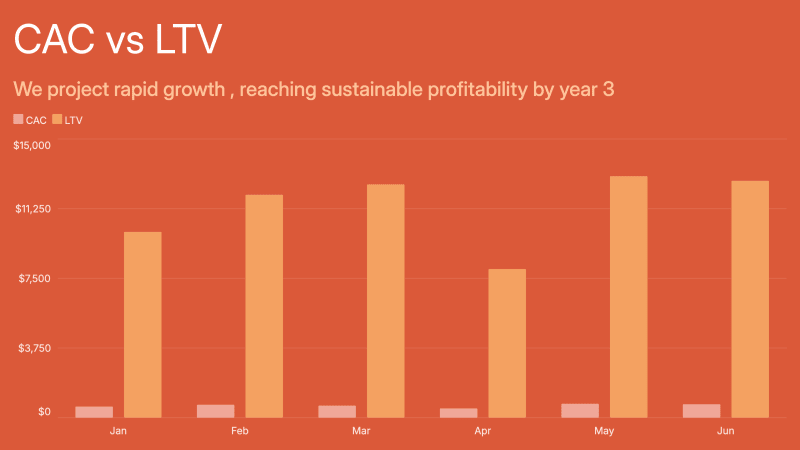
CAC vs LTV Chart
Tech · Bar Chart

Monthly Profit and Loss Chart
Finance · Bar Chart
Revenue Distribution by Source
Tech · Bar Chart

Enterprise Key Financials Expenditure
Finance · Bar Chart
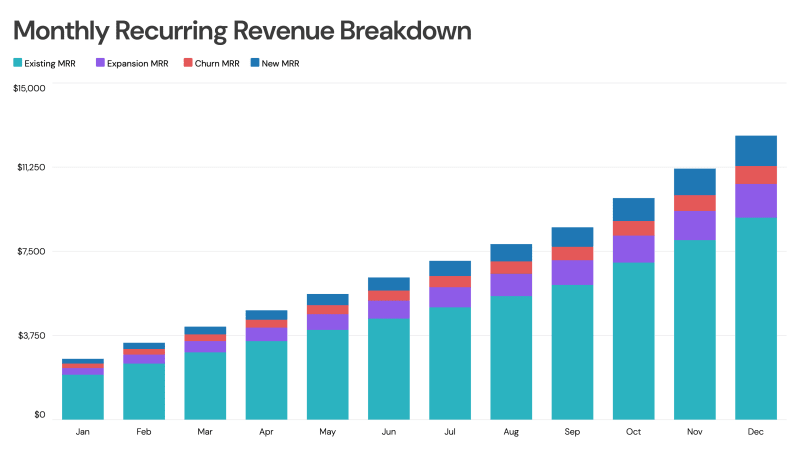
Monthly Recurring Revenue Breakdown
Tech · Bar Chart

Sales Cycle Length
Sales · Bar Chart
Rental Income vs Expenses
Rental Income vs Expenses
Real Estate · Bar Chart
Cash-on-Cash Return Chart
Cash-on-Cash Return Chart
Real Estate · Bar Chart
Capital Deployed Over Time
Capital Deployed Over Time
Finance · Bar Chart
Realized vs Unrealized Gains
Realized vs Unrealized Gains
Finance · Bar Chart
Year-Over-Year Revenue Chart
Year-Over-Year Revenue Chart
Finance · Bar Chart
Quarterly Business Review Chart Template
Quarterly Business Review Chart Template
Sales · Bar Chart
Revenue by Channel Chart
Revenue by Channel Chart
Marketing · Bar Chart
Customer LTV vs CAC Chart
Customer LTV vs CAC Chart
Marketing · Bar Chart
Repeat vs New Customer Revenue Chart
Repeat vs New Customer Revenue Chart
Marketing · Bar Chart
Revenue per Provider Chart
Revenue per Provider Chart
Healthcare · Bar Chart
Same-Store Sales Growth Chart
Same-Store Sales Growth Chart
Restaurant · Bar Chart
Average Revenue per Location Chart Template
Average Revenue per Location Chart Template
Restaurant · Bar Chart
Revenue vs Industry Benchmark Chart
Revenue vs Industry Benchmark Chart
Finance · Bar Chart
Revenue Chart Template
Revenue Chart Template
Finance · Bar Chart
Sales Chart
Sales Chart
Finance · Bar Chart
Data Distribution Chart
Data Distribution Chart
Tech · Bar Chart
Profit vs Revenue Chart
Profit vs Revenue Chart
Finance · Bar Chart
When to use a bar chart template
Revenue comparisons and breakdowns
Compare revenue by channel, client, geography, or service line. Bar charts make it immediately clear which category is contributing most — and which is lagging.
Financial performance vs. targets
Plot actual vs. budget, quarterly business reviews, or year-over-year revenue. Grouped bar charts show both the comparison and the gap in a single view.
Rankings and top-N lists
Show top products by revenue, sales cycle length by rep, or average revenue per location. Ordered bar charts communicate rankings at a glance — no table required.
Cost and expense analysis
Break down CAC vs. LTV, profit and loss by month, or expense categories. Bar charts keep financial data scannable in investor decks and internal reports.
How to make an animated bar chart
AECharts turns your spreadsheet data into a smooth animated video — no After Effects, no screen recording.
Paste or upload your data
CSV, Excel, or paste directly from a spreadsheet. AECharts reads your columns — categories and values — and builds the bar chart automatically.
Choose a template and customise
Pick from animated bar chart templates. Adjust colours, fonts, bar spacing, and labels. Apply your Brand Kit to keep every chart consistent.
Export as 1080p MP4
Click export. Clean 1080p animated video in ~5 seconds. Ready for LinkedIn, presentations, social media, or newsletters.
Start with a bar chart template
Free to use. Export 1080p MP4 on paid plans. No design software needed.
FAQ
Related pages