Bar Chart Race Maker
Create viral bar chart race animations that show rankings changing over time. Watch categories compete, overtake, and swap positions with smooth animation. Ideal for GDP comparisons, brand popularity, sports standings, and any data that evolves over time.
Why Use a Bar Chart Race?
Viral Social Media Content
Bar chart races are among the most shared data visualizations on TikTok, Instagram, and YouTube. The racing animation creates natural suspense that keeps viewers watching.
Show Change Over Time
Unlike static charts, bar chart races reveal how rankings shift across years or decades. Viewers see the full story unfold — which countries rose, which brands fell, who overtook whom.
Easy to Understand
No chart-reading skills needed. Anyone can follow bars racing against each other. The format is intuitive for all audiences, from boardrooms to classrooms.
Popular Use Cases
GDP by country, most popular programming languages, top-selling products, population growth, brand value rankings, sports team standings, and streaming platform subscribers.
More Bar Race Templates
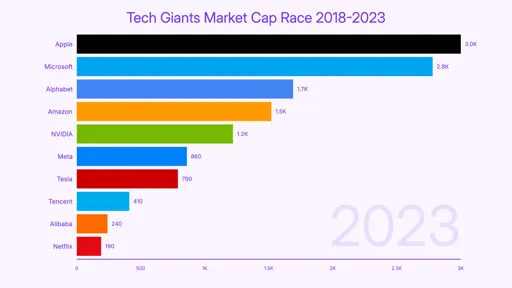
Tech Companies
Market cap race between Apple, Microsoft, Google, Amazon, and Meta over the past decade.
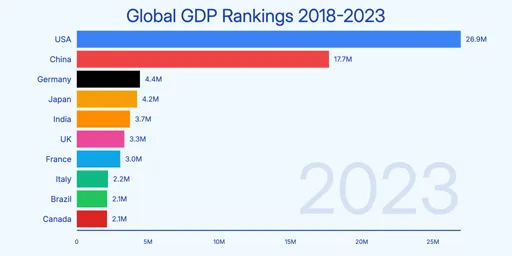
GDP by Country
Watch the US, China, Japan, and Germany trade positions as their economies grow from 2000 to 2023.
Premier League Standings
Season points race for Premier League clubs — Man City dominance, Leicester's miracle, Arsenal's revival.
Programming Languages
The rise of Python and TypeScript, the decline of PHP, and JavaScript's steady dominance from 2013 to 2023.
How to Create a Bar Chart Race Video
Four steps from raw data to finished MP4:
Choose a template
Browse bar chart race templates and pick one that fits your data — GDP by country, tech companies, sports standings, or start from scratch.
Paste your data
Copy time-series data from Excel or Google Sheets and paste it in. Each row is a time point; each column is a category. AECharts formats it automatically.
Customize style
Adjust bar colors, labels, title, font, and animation speed. Every element is editable — match your brand or use a clean default.
Preview & export
Watch the race animation in real-time. When it looks right, export as MP4. Download and share on YouTube, TikTok, LinkedIn, or anywhere.
Related
- Animated Bar Chart Maker — create standard animated bar charts
- Animated Charts for YouTube Videos — tips for using chart animations in video content
- Types of Bar Charts — when to use a bar race vs. other bar chart formats
Bar Chart Race FAQ
Create Your Bar Chart Race Video
Paste your time-series data, pick a template, and export as MP4 in seconds. No video editing software needed.