Line Chart Template
Animated line chart templates for trends, growth, and time series data. Pick a template below, paste your data, and export a clean 1080p animated video in seconds — no design skills required.
Every template is fully customisable: adjust colours, fonts, axis labels, and animation speed. Apply a Brand Kit to keep charts consistent across decks, reports, and social posts.
Line chart examples
Real-world line chart examples across finance, healthcare, e-commerce, and more. Use any as a starting point.
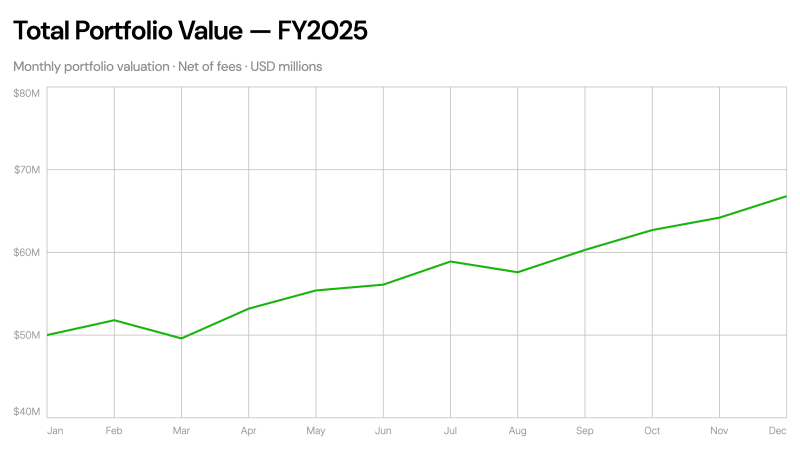
Total Portfolio Value Over Time
Finance · Line Chart
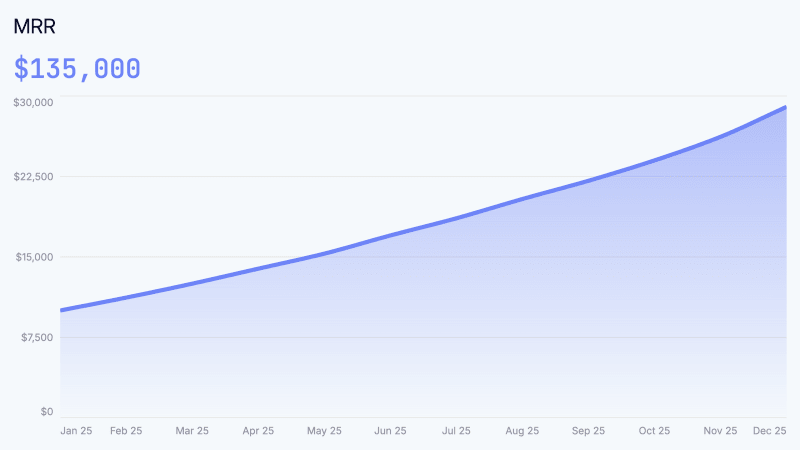
MRR Chart
Tech · Line Chart
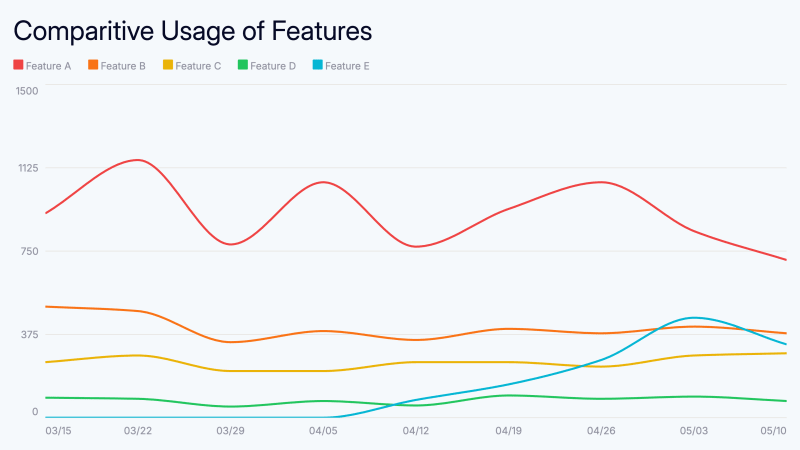
Feature Usage
Tech · Line Chart
Property Value Over Time
Property Value Over Time
Real Estate · Line Chart
Occupancy Rate Chart
Occupancy Rate Chart
Real Estate · Line Chart
NOI Trend Chart
NOI Trend Chart
Real Estate · Line Chart
Fund Performance vs Benchmark
Fund Performance vs Benchmark
Finance · Line Chart
AUM Growth Chart
AUM Growth Chart
Finance · Line Chart
Gross Margin Trend Chart
Gross Margin Trend Chart
General · Line Chart
Break-Even Analysis Chart
Break-Even Analysis Chart
General · Line Chart
E-Commerce Revenue Growth Chart
E-Commerce Revenue Growth Chart
General · Line Chart
Practice Revenue Growth Chart
Practice Revenue Growth Chart
Healthcare · Line Chart
Patient Volume Growth Chart
Patient Volume Growth Chart
Healthcare · Line Chart
Practice EBITDA Trend Chart
Practice EBITDA Trend Chart
Healthcare · Line Chart
Restaurant EBITDA Margin Chart
Restaurant EBITDA Margin Chart
General · Line Chart
Restaurant Revenue Growth Chart
Restaurant Revenue Growth Chart
General · Line Chart
When to use a line chart template
Revenue and MRR trends
Show monthly recurring revenue, total revenue, or ARR growth over quarters. Line charts make the trajectory immediately legible to investors and stakeholders.
Portfolio and investment performance
Track total portfolio value, AUM growth, or fund performance vs. a benchmark over time. Clean line charts communicate returns without cluttering the visual.
Business health metrics
Plot gross margin trend, EBITDA over time, or break-even analysis. Ideal for board decks, investor updates, and quarterly business reviews.
Growth and engagement over time
Visualise user growth, patient volume, occupancy rates, or e-commerce revenue growth month over month across any industry.
How to make an animated line chart
AECharts turns your spreadsheet data into a smooth animated video — no After Effects, no screen recording.
Paste or upload your data
CSV, Excel, or paste directly from a spreadsheet. AECharts reads your columns — date and value — and builds the line chart automatically.
Choose a template and customise
Pick from animated line chart templates. Adjust colours, fonts, and labels. Apply your Brand Kit to keep every chart on-brand.
Export as 1080p MP4
Click export. Clean 1080p animated video in ~5 seconds. Ready for LinkedIn, presentations, social media, or newsletters.
Start with a line chart template
Free to use. Export 1080p MP4 on paid plans. No design software needed.
FAQ
Related pages