How to Insert a Waterfall Chart into Google Slides
Google Slides doesn't support waterfall charts natively. Build one from your real data in AECharts, then export it into your deck or insert it directly with the Google Slides add-on.
Build the Chart
Start from a waterfall template
Open AECharts and pick a waterfall template already styled for P&L, cash flow, or budget bridges, or start from a blank chart.
Paste your data
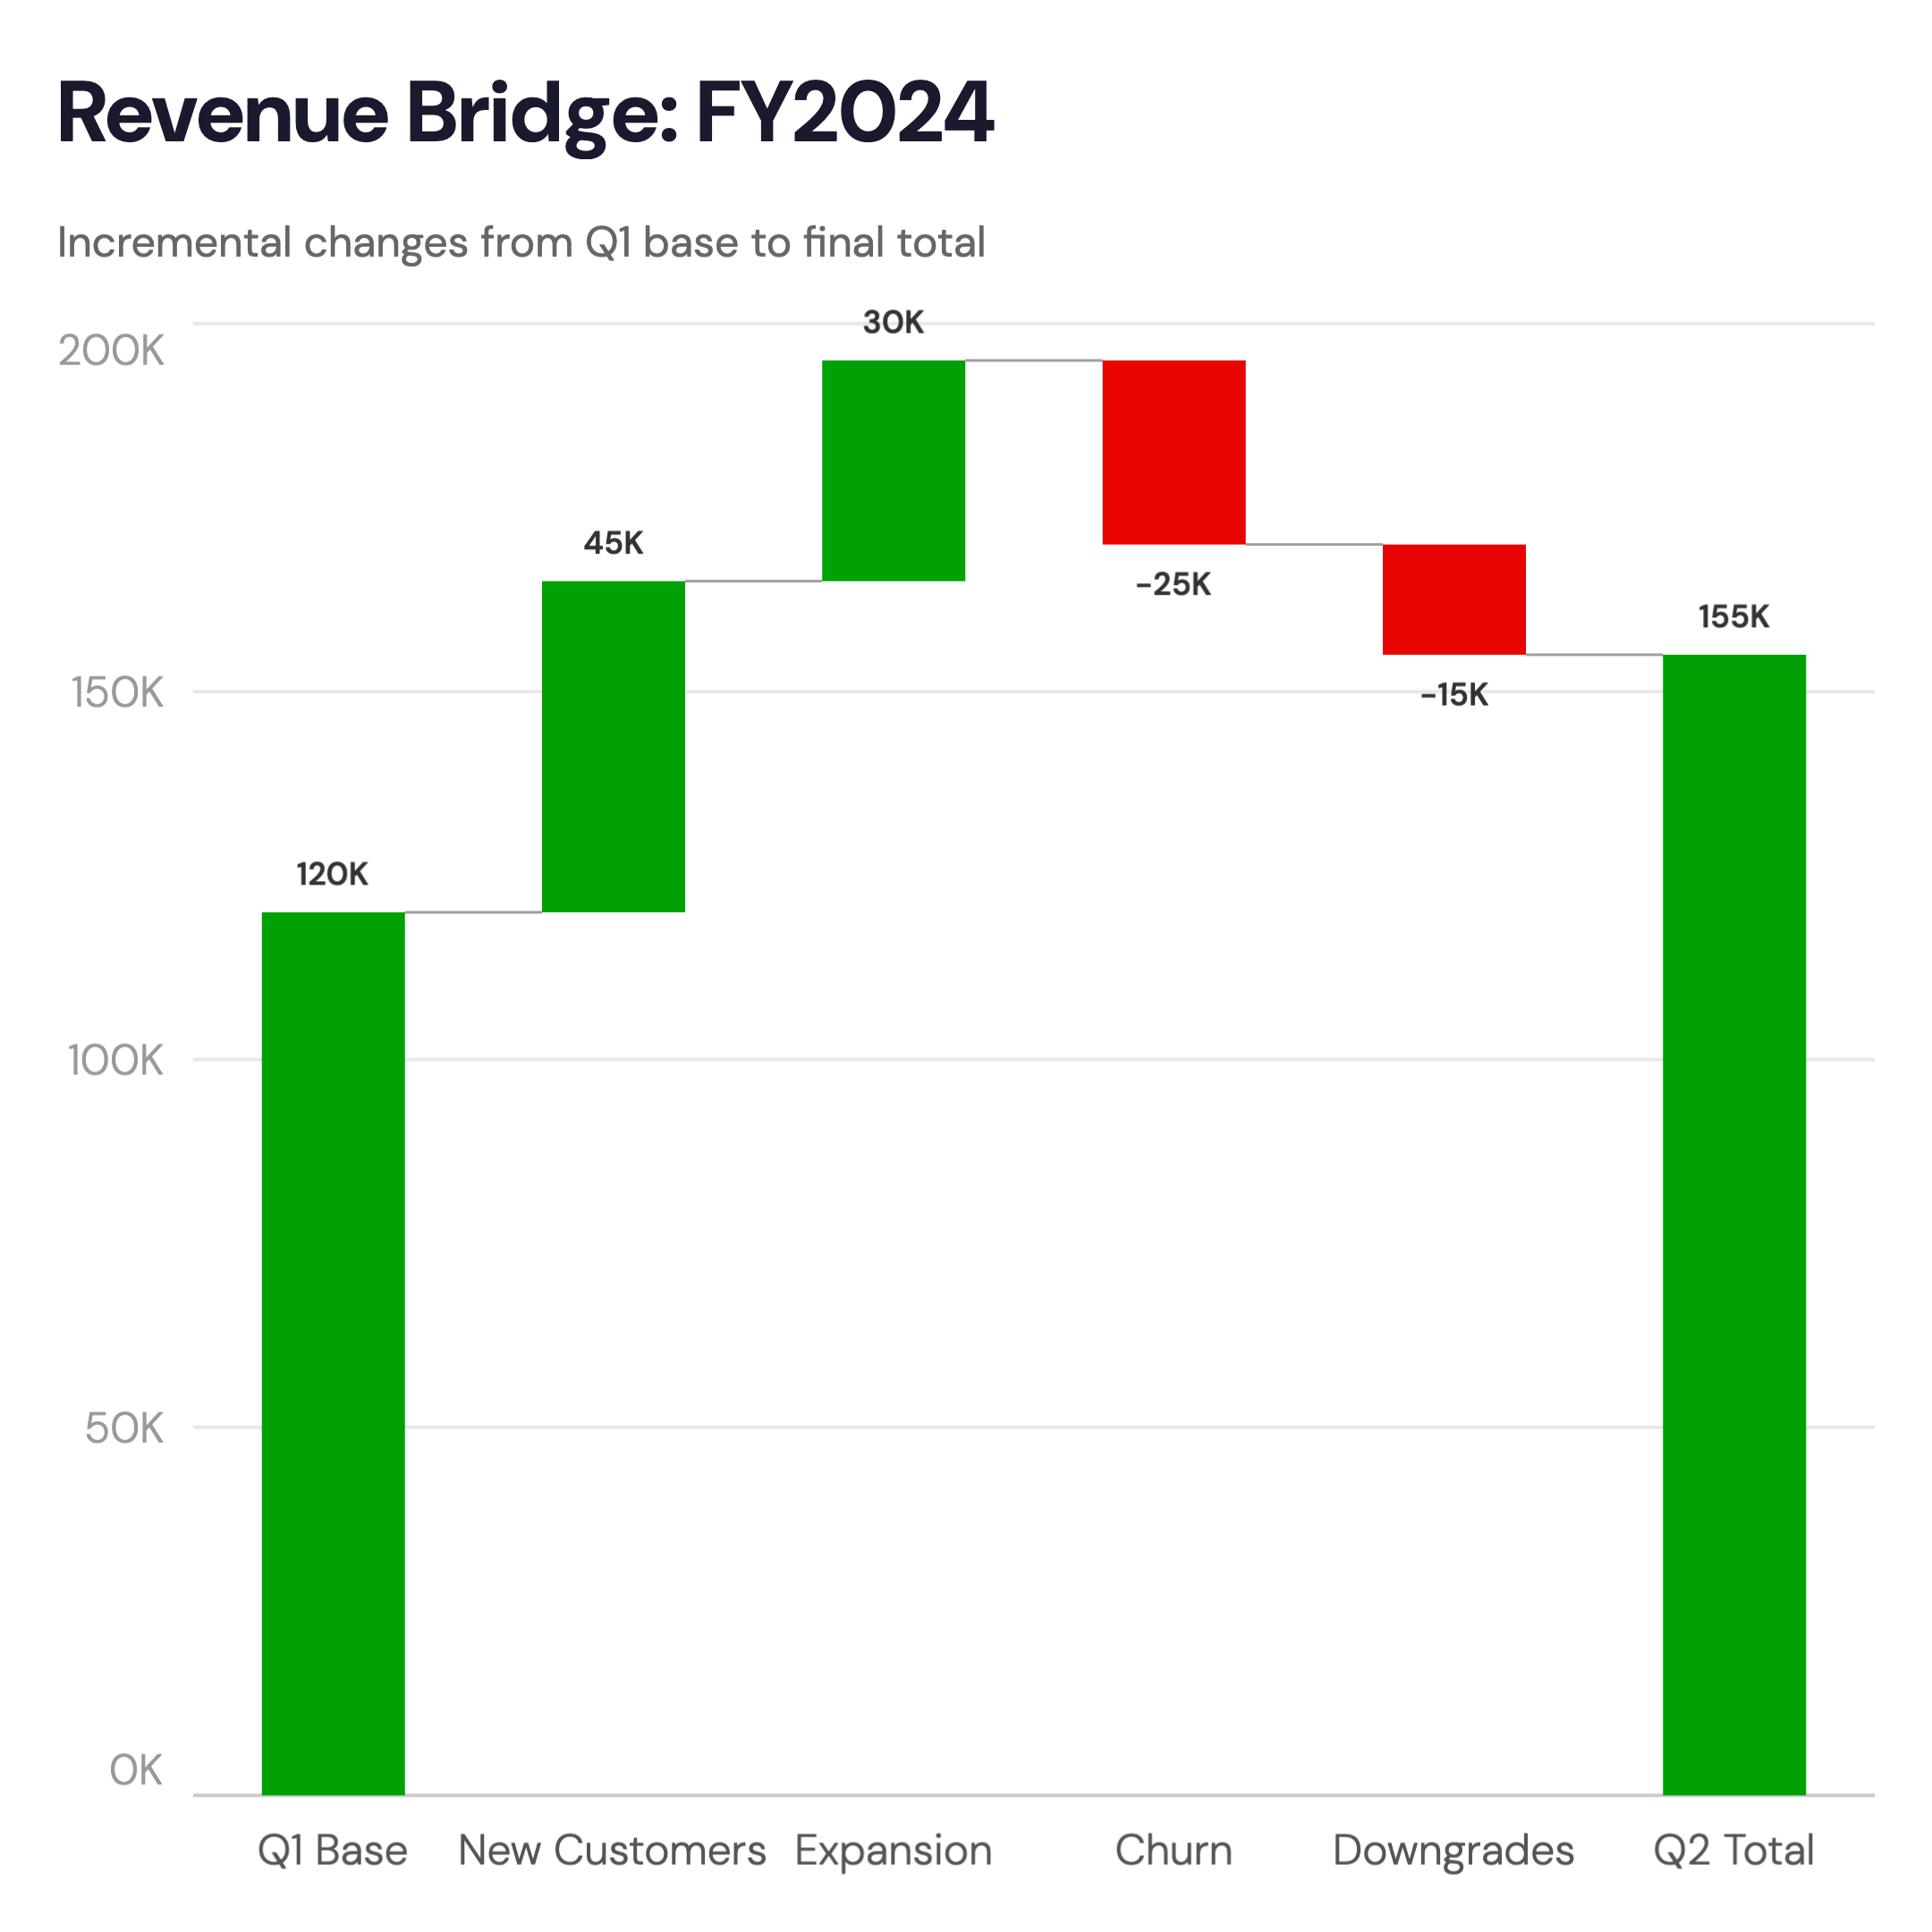
Two columns: Category and Value. Positive values add to the running total, negative values subtract. Leave Value blank on a row, for example an "Ending Revenue" row, and AECharts renders it as a subtotal or total bar instead of a step. Paste straight from Excel, Google Sheets, or a CSV, no reformatting needed.
Set colors for gains, losses, and totals
The style panel has separate color controls for increase, decrease, and total bars, plus the value labels shown inside each bar and the connector line between them. Add a prefix like "$" or a suffix like "%" so labels read correctly without reformatting your data.
Get it into your deck
Export as a PNG and paste it onto your slide. Or install AECharts for Google Slides, a sidebar that lists your saved charts, and click one to insert it directly, no export needed.
Install AECharts for Google Slides to insert saved charts from the sidebar instead of exporting.
Frequently Asked Questions
Related