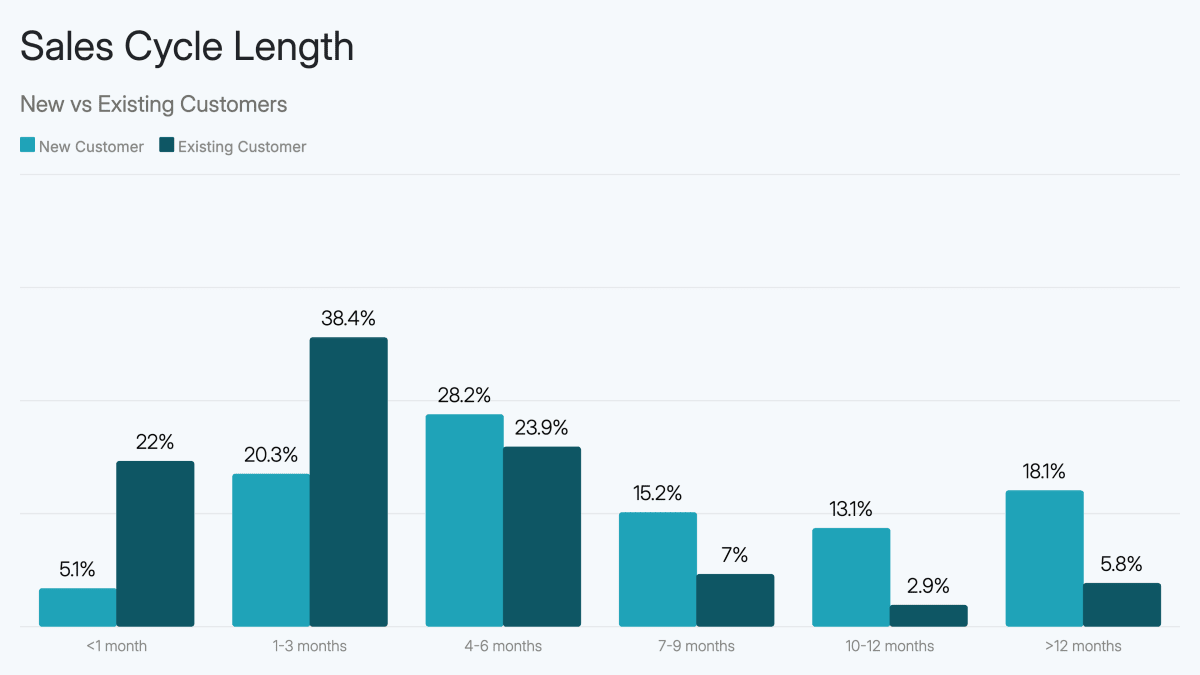
Sales Cycle Length
Measure how long it actually takes to close deals — broken down by rep, segment, or deal size. This chart gives sales leaders and revenue operations teams a clear view of pipeline velocity, making it easy to benchmark performance, identify bottlenecks, and track whether process changes are speeding up deal closure.
Use this as a starting point or browse all bar chart templates.
Related Examples
CAC vs LTV ChartMonthly Profit and Loss ChartRevenue Distribution by SourceEnterprise Key Financials Expenditure
More sales chart examples →