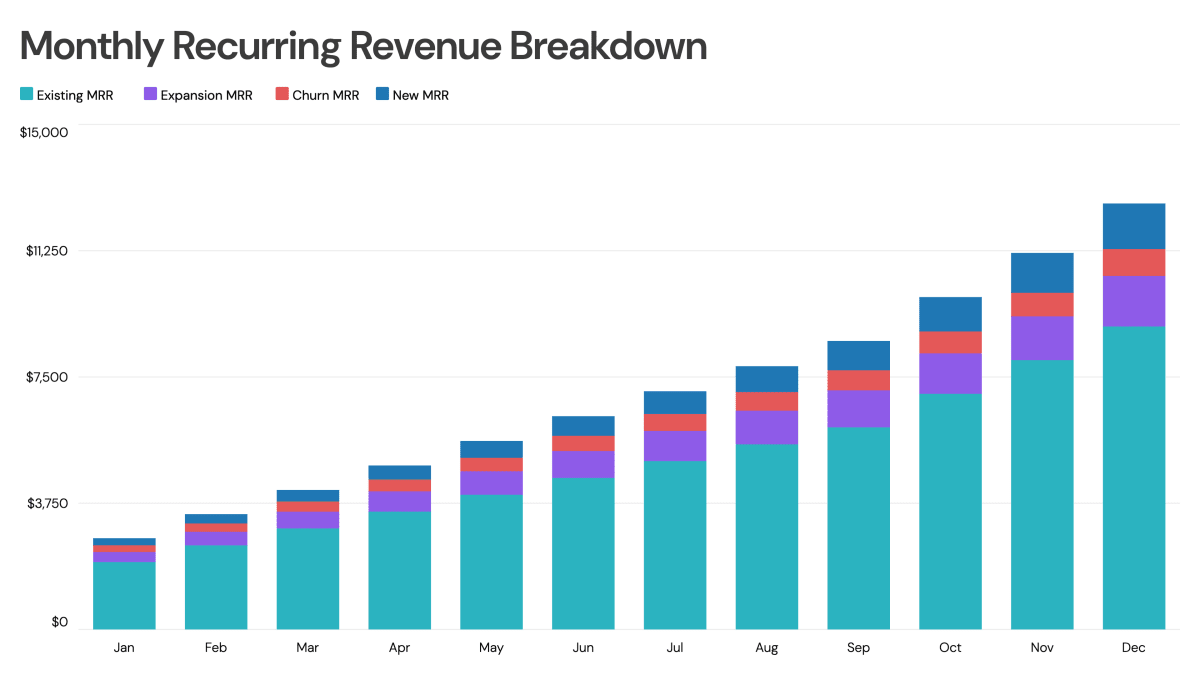
Monthly Recurring Revenue Breakdown
Go beyond headline MRR and see exactly where your growth comes from. This chart breaks MRR into new, expansion, and churned components — making it easy to spot whether growth is driven by acquisition, upsells, or is being eroded by churn. Essential for SaaS investor decks, board updates, and monthly business reviews.
Use this as a starting point or browse all bar chart templates.
Related Examples
CAC vs LTV ChartMonthly Profit and Loss ChartRevenue Distribution by SourceEnterprise Key Financials Expenditure
More tech & saas chart examples →