Charts designed to be published
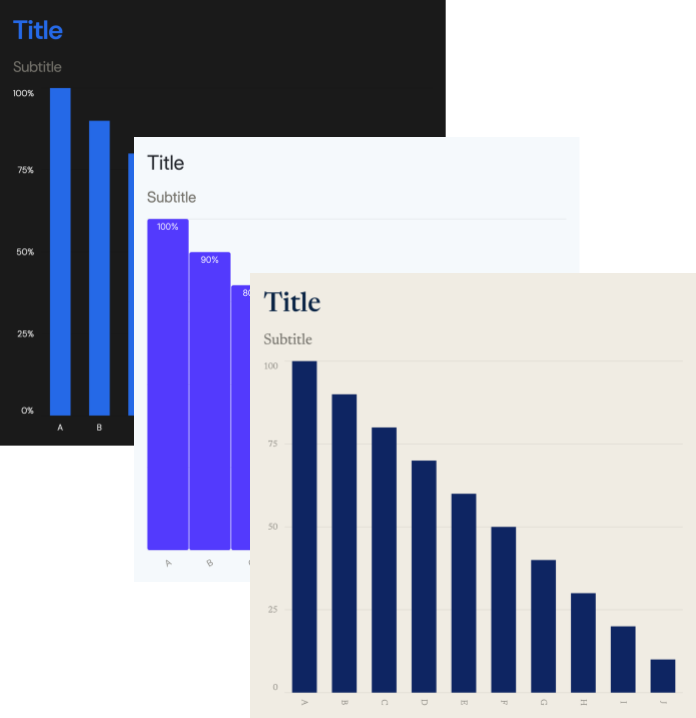
Brand consistency Your fonts, colors and logo applied to every chart automatically.
Animated by default Every chart you make is already a video, no additional tools needed.
Flexible exports JPEG, PNG & MP4 of all sizes with presets for reports, decks and social.
Workflow
Pick a template
Choose from a growing library of templates with 8+ chart types
Edit data and style
Enter your data in a simple spreadsheet interface. Copy-paste from Excel or Google Sheets. Customize colors, fonts, labels, and animation speed. See changes in real-time.
Export Chart
Export your chart as JPEG, PNG, PNG transparent, MP4. Perfect for social media, presentations, and marketing content.
Who it's for

Newsletters & Content Creators
Create polished data charts for Substack posts, social media, and blog content.

Media, Journalism & Newspapers
Build editorial-ready charts for news articles, explainers, and data journalism.

Marketing Teams
Turn campaign and growth metrics into branded visuals for reports, decks, and social.

Startup Founders & VC Firms
Share traction, portfolio insights, and investor updates with clear visual storytelling.

Strategy, Research & Operations Teams
Present market analysis and performance trends for reports, presentations, and decisions.