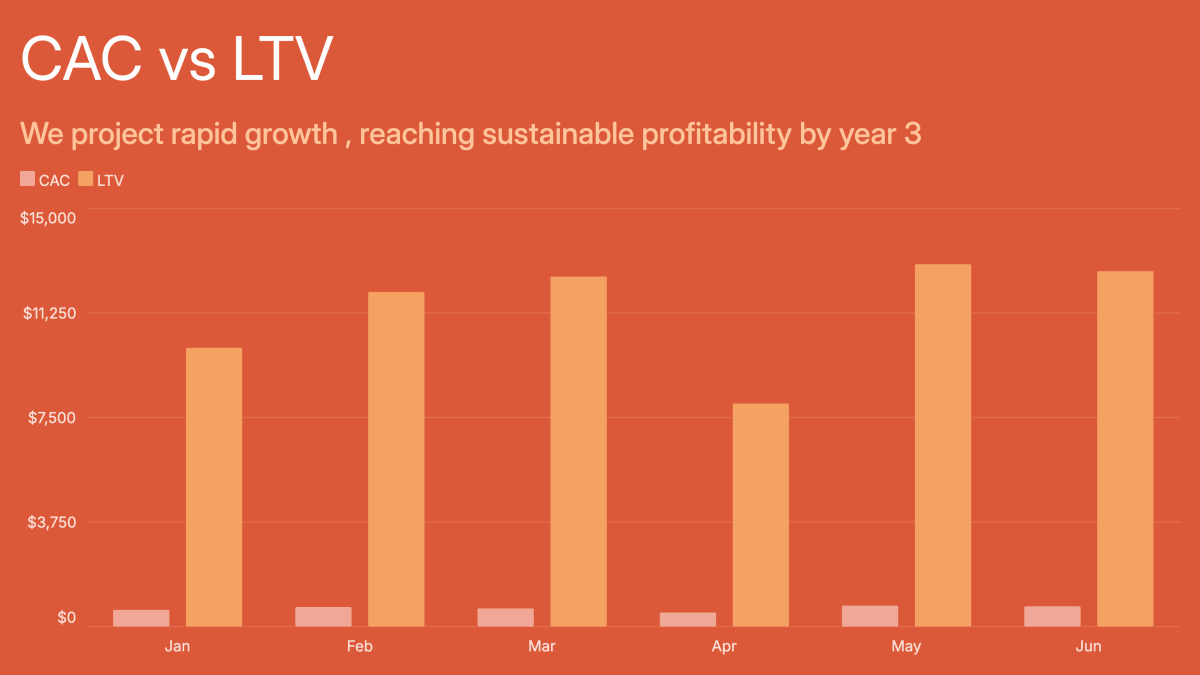
CAC vs LTV Chart
The most important unit economics chart for any SaaS business. This grouped bar chart puts Customer Acquisition Cost and Lifetime Value side by side, making it immediately clear whether your growth is profitable. Essential for investor decks, board updates, and quarterly business reviews.
Use this as a starting point or browse all bar chart templates.
Related Examples
Monthly Profit and Loss ChartRevenue Distribution by SourceEnterprise Key Financials ExpenditureMonthly Recurring Revenue Breakdown
More tech & saas chart examples →