Turn text into charts and diagrams
Paste any text that has data in it. The AI reads it, picks the right chart or diagram, and builds it for you. Then adjust the style and export to PowerPoint, PNG, or video.
No login required
How it works
Paste your text
Copy anything that has data in it — a table from a spreadsheet, a bullet list with numbers, a sentence like 'sales were up 40% in Q3.' Paste it in as-is.
AI picks the right chart or diagram
It reads what you pasted, figures out what kind of visual makes sense, and builds it. You don't have to choose a chart type or reformat your data first.
Adjust and export
Change colors, fonts, and labels. Try a different chart type if you want. Export as a PowerPoint file, PNG image, or animated video when you're ready.
Charts and diagrams it can make
From a simple bar chart to a waterfall P&L bridge — the AI picks the type that fits your data.
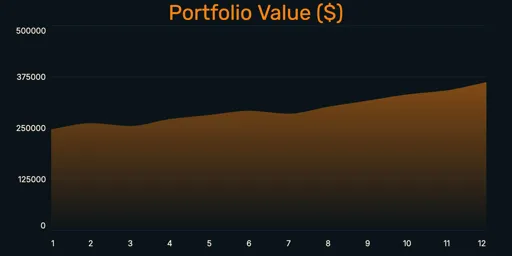
Line chart
Revenue or metric over time
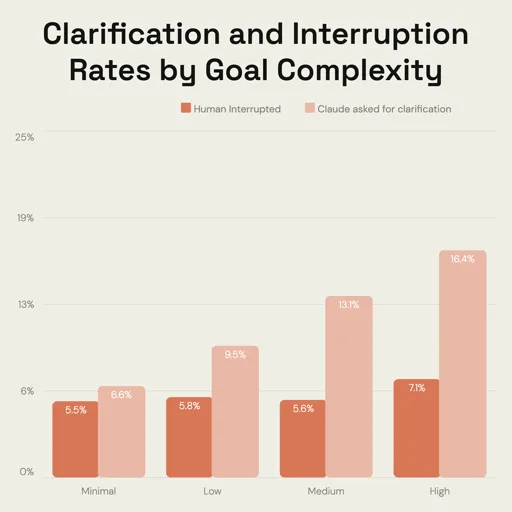
Grouped bar chart
Side-by-side comparison
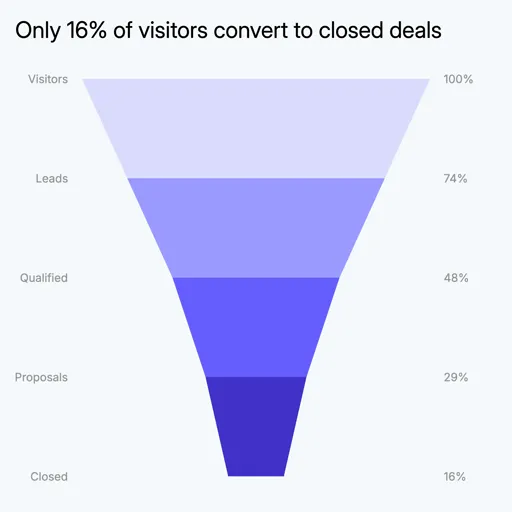
Funnel chart
Drop-off at each stage
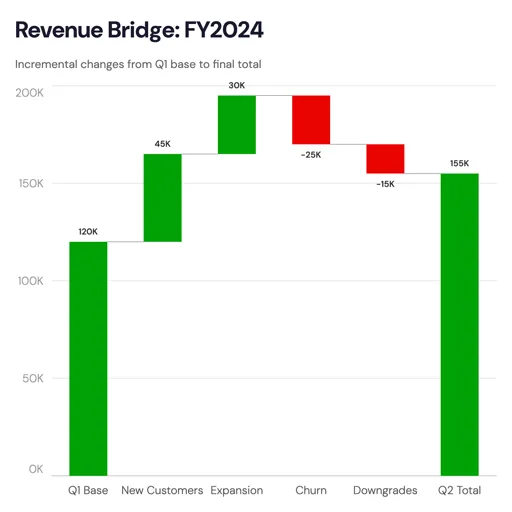
Waterfall chart
P&L bridge, budget variances
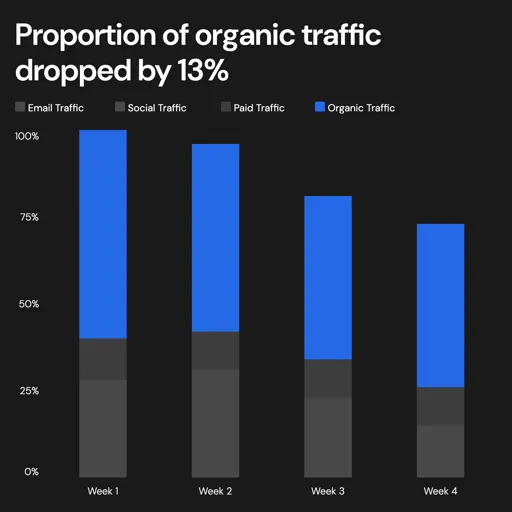
Stacked bar chart
Composition across categories
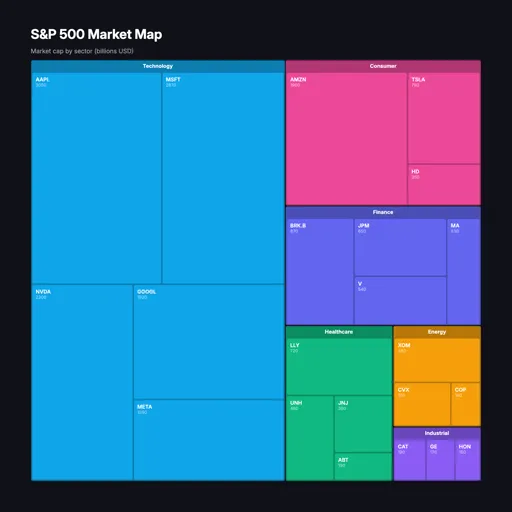
Treemap
Part-to-whole by area
It uses your data, not made-up numbers
A lot of AI tools that claim to make charts from text will just invent data to fill the chart. Ask for "quarterly revenue" and they'll fabricate numbers that look plausible. That's fine for a rough mockup, but not for anything you're actually going to share.
This tool reads what you paste. The chart shows your actual numbers, nothing else.
20+ chart and diagram types
Standard charts like bar, line, and pie. Plus chart types that PowerPoint and Google Slides don't have natively, like waterfall, Pareto, Marimekko, and dumbbell charts.
- Bar chart
- Grouped bar chart
- Stacked bar chart
- Horizontal bar chart
- Bar chart race
- Line chart
- Area chart
- Line chart race
- Scatter chart
- Dumbbell chart
- Pie chart
- Donut chart
- Waterfall chart
- Pareto chart
- Marimekko chart
- Funnel chart
- Treemap
- Gauge chart
- Radar chart
- Waffle chart
Export for wherever you need it
Watermark removed on paid plan — $12/month or $120/year.
FAQ
Related