Return Distribution by Tracking Error Level
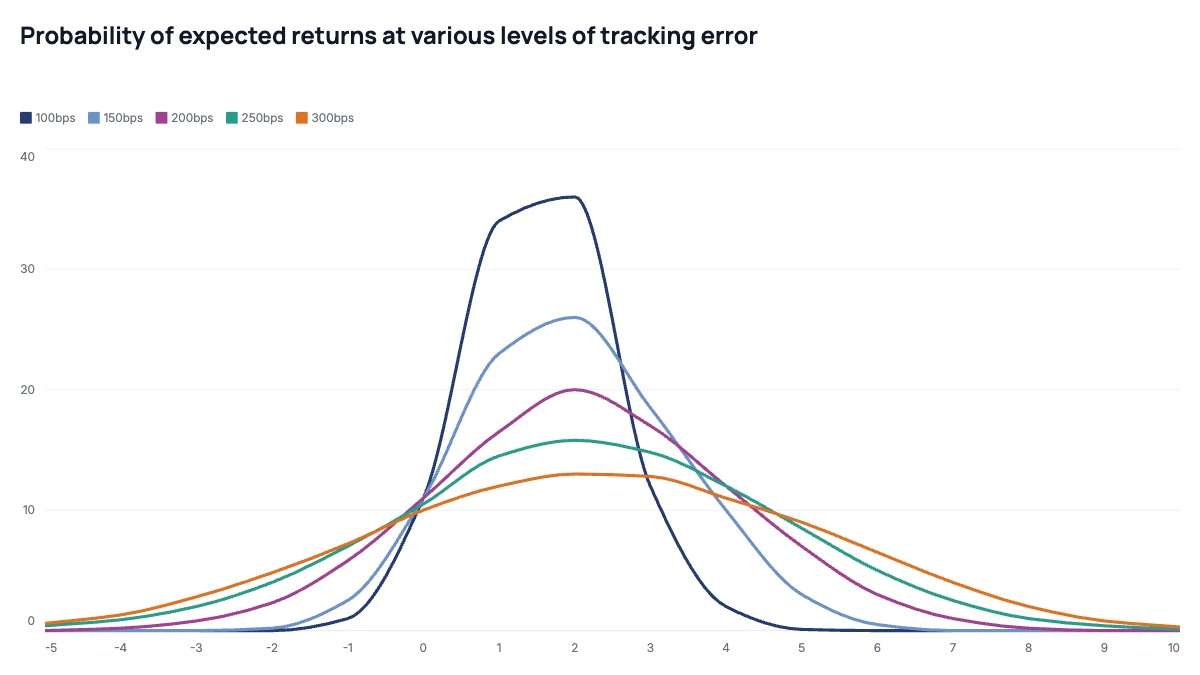
Each curve in this chart is a normal distribution centered on the same expected excess return but with a different standard deviation, corresponding to a tracking error level in basis points. The narrowest, tallest curve (100bps) concentrates probability near the expected return. The widest, flattest curve (300bps) spreads probability across a much broader range. The x-axis crossing at 0% excess return shows the probability of underperformance for each level. Reading across all five curves simultaneously, the chart makes the fundamental tradeoff of active management visible: higher tracking error creates more upside potential but also widens the left tail.
Asset managers and institutional investors use this format to communicate active risk budget implications. A factor-based equity manager shows clients how increasing tracking error from 100bps to 300bps spreads outcomes without changing the expected excess return. Pension fund investment committees use it to set tracking error limits for external mandates, since the visual makes the consequence of those limits legible without requiring statistical fluency. Sell-side analysts include it in factor research notes and smart beta product explanations. The format also appears in KIID documents for UCITS funds and in investment consultant reports comparing active versus passive strategies.
Five curves is near the upper limit for this format. Beyond five, lines overlap too densely and the color palette becomes confusing. Order series from lowest to highest tracking error so the narrowest curve sits on top and establishes the baseline. Use a sequential palette, a dark anchor color for the lowest tracking error and progressively lighter or warmer shades for each step up, so the visual gradient reinforces the risk direction. Label series in the legend rather than directly on the curves, since they intersect near the tails. The most actionable annotation is a vertical reference at 0% excess return showing the probability of underperformance for each curve.