Free Line Chart Templates
Browse line chart templates for growth, trends, and time-series data, a single series tracked over time. Use them for revenue, traffic, product metrics, and any story that unfolds over time.
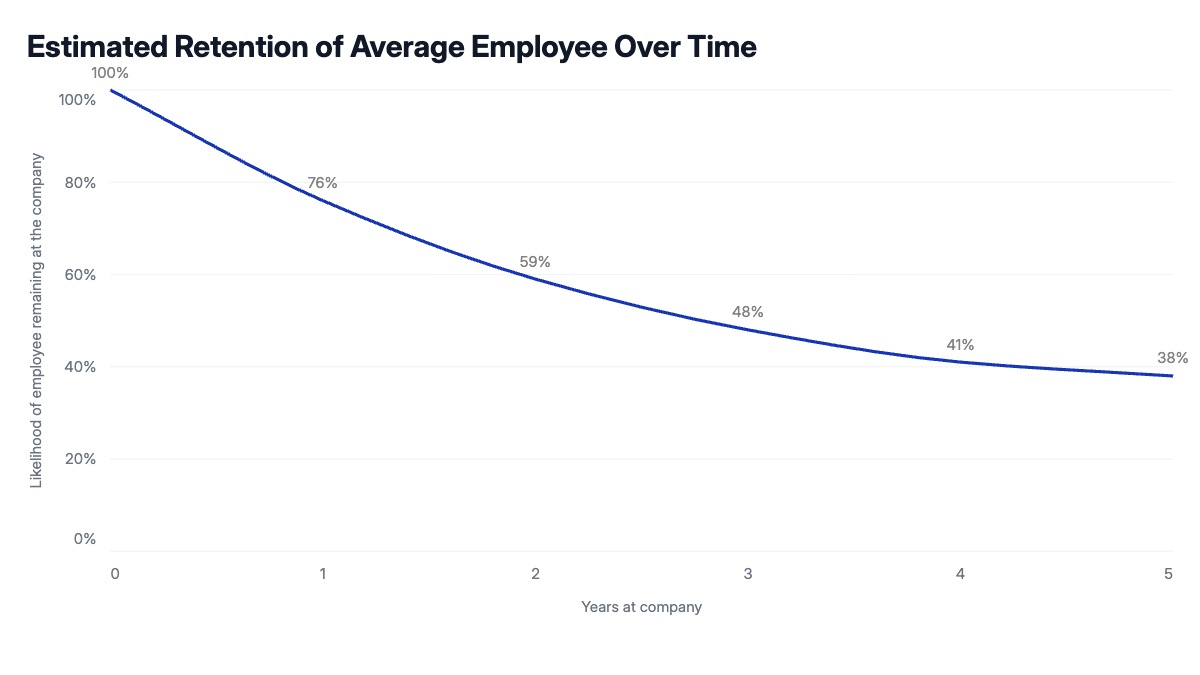
Line chart templates for presentations
A line chart is the standard format for showing how a single metric changes over time: revenue growth, user acquisition, stock price, or any data tracked across weeks, months, or years. If you need to compare two or more trend lines on the same chart, see the multi-series line templates instead. Pick a template, paste your data, and drop it straight into your deck.
What data works best for a line chart?
Line charts are ideal for time series data: anything with a date or period on the x-axis and a single value tracked over that period.
Can I show multiple lines on the same chart?
Yes, using the multi-series line templates. AECharts supports multiple series on a single line chart, each with its own color, series labels, and a legend.