Hiring Pipeline Funnel Chart
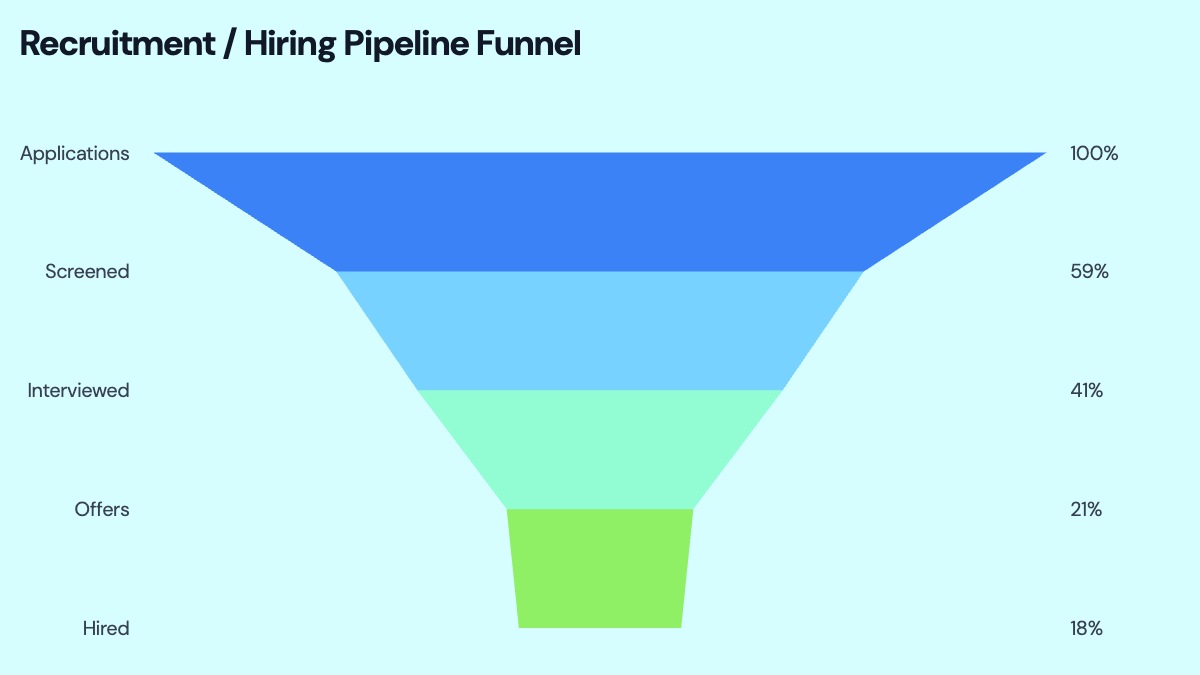
A hiring pipeline funnel chart maps how candidates flow through a recruitment process from application to hire. The top of the funnel holds all applicants. Each stage below — resume screened, phone screen, first interview, final round, offer extended, offer accepted — shows the number of candidates who advanced. The shape of the funnel reveals where the pipeline is efficient and where it leaks: a wide gap between applications and screens suggests volume without quality; a gap between offers and acceptances points to a compensation or candidate experience problem.
This chart is a standard deliverable in talent acquisition reviews, headcount planning decks, and HR leadership presentations. People ops teams use it to show how much top-of-funnel volume is needed to produce a target number of hires. Finance teams use it when modeling recruiting costs per hire, since stage-level conversion rates determine how many screens, interviews, and offers each hire requires. For companies scaling quickly or presenting hiring data to investors, this funnel provides the clearest single view of recruiting efficiency.
The template uses a five-stage structure covering the most common steps in a structured interview process, but the stages can be renamed to match any hiring workflow — from high-volume hourly hiring to executive search. Stage counts, colors, labels, and fonts are all editable in the chart editor. The finished chart exports as PPTX, PNG, or MP4.