Best think-cell Alternatives for Google Slides in 2026
think-cell doesn't run in Google Slides — it never has. It's a PowerPoint and Excel add-in, and Slides uses a completely different, web-based add-on architecture that think-cell hasn't built for. think-cell's own documented workaround is to build the chart in PowerPoint and paste it into Slides as a static image, which breaks the moment the data changes. Below are the tools built to actually work inside Slides, or to feed it a chart image that looks the way you designed it.
Updated August 2026.
| Tool | Pricing |
|---|---|
 AECharts AECharts | Free (watermark); Pro $12/month or $120/year |
 Vizzlo Vizzlo | Free (watermark); Professional $19/month; Teams $69/month (5 seats) |
| Free trial (10 sessions); €10/month or €100/year | |
 Native Google Slides charts Native Google Slides charts | Free |
Why think-cell doesn't work in Google Slides
think-cell is built as a native PowerPoint and Excel add-in — it hooks directly into desktop Office's object model. Google Slides is a web app with its own separate add-on system, and think-cell has never built a version for it. This isn't a missing feature waiting on a future update; it's a structural gap between two different platforms.
The workaround think-cell itself documents: build the chart in PowerPoint, export it as a picture, and paste that picture into Slides. The chart lives in PowerPoint and Slides just gets a flat image of it — two separate files for one chart, with no advanced chart types native to Slides at all.
Feature comparison
Updated August 2026.
| Feature | AECharts | Vizzlo | Chartbuddy | Native Google Slides charts |
|---|---|---|---|---|
| Advanced charts (waterfall, Mekko) | Yes | Yes | Yes | No |
| Gantt chart support | Yes | Yes | No | No |
| AI-assisted editing | Yes — plain-English style edits on the chart itself | Preview — generates a new chart from a prompt, not for editing existing ones | No | No |
| How the chart lands on the slide | Image export, or insert + one-click refresh via the add-on | Live linked object | Native inserted chart | Linked to Google Sheets |
| Installation required | None required; optional Google Slides add-on for insert + refresh | Google Slides add-on | Chrome extension | None |
| Chart usable outside Google Slides | Yes — exports as its own image/video file | Yes | No — lives only inside the Slides deck | No |
| Works in PowerPoint too | Yes (same image export) | Yes | No | No |
| Free tier | Yes (watermark) | Yes (watermark) | Free trial (10 sessions) | Yes (always free) |
| Starting paid price | $12/month | $19/month | €10/month | — |
Detailed breakdown
1. AECharts
Best for advanced chart types Slides doesn't support natively
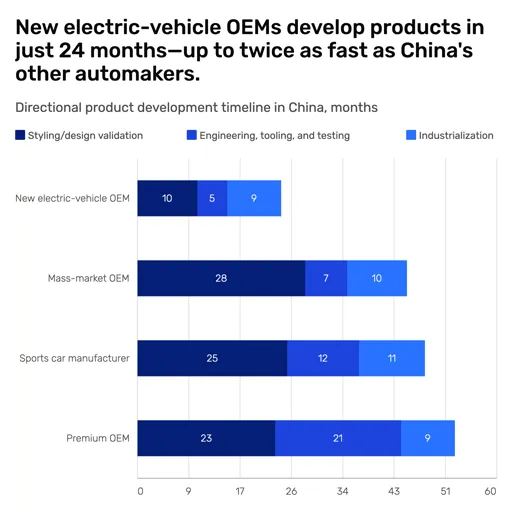
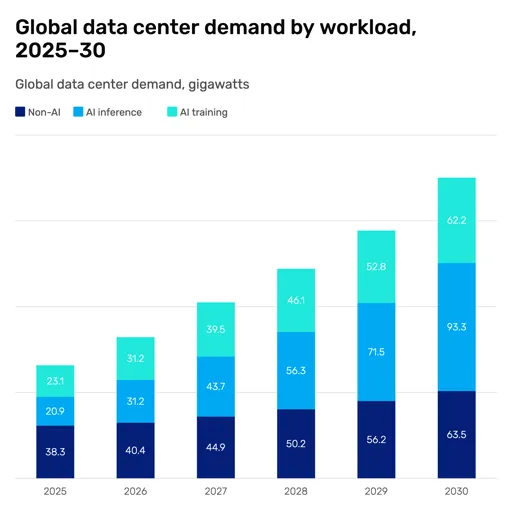
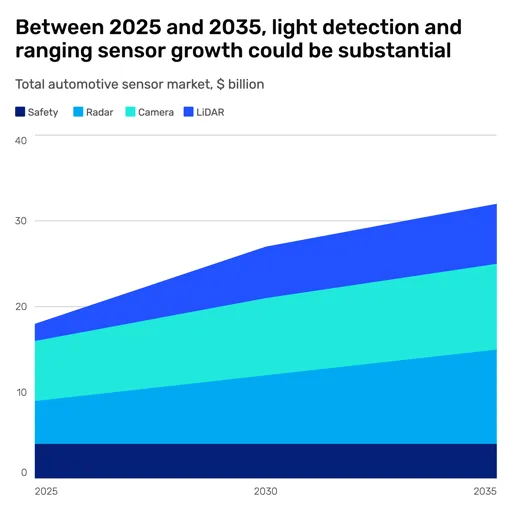
AECharts is a browser-based chart builder for waterfall, Mekko, Gantt, and scatter charts — the same chart set think-cell users rely on. Build the chart, export it as an image, and drop it into Google Slides, where it renders exactly as designed, or use the Google Slides add-on to insert and refresh it in place. No PowerPoint detour, works the same on Mac and Windows.
Pricing: Free (watermark); Pro $12/month or $120/year
Strengths
- Advanced chart types Google Slides can't build natively: waterfall, Mekko, Gantt, scatter
- Runs entirely in the browser, no installation required to build or export a chart
- Optional Google Slides add-on: insert charts directly and refresh them in place with one click
- Exports as an image that drops into Google Slides, PowerPoint, and Keynote with identical rendering in each
- Imports from Google Sheets or any public CSV/XLSX URL
- AI panel: describe a style change in plain English instead of hunting through a formatting menu
- Pro at $12/month with no per-seat licensing
Limitations
- Without the add-on, updating a chart means re-exporting and replacing it in the slide manually
- The add-on refresh is a manual one click, it doesn't auto-detect when the source Sheet changes
- Free tier exports carry a watermark; Pro removes it
2. Vizzlo
Best for teams that want charts linked live inside the slide
Vizzlo has a Google Slides add-on that inserts a chart onto the slide and keeps it linked back to vizzlo.com — edit the data and the slide updates. It covers 120+ chart types including waterfall and Mekko, and also works with PowerPoint if your team splits between the two.
Pricing: Free (watermark); Professional $19/month; Teams $69/month (5 seats)
Strengths
- Google Slides add-on with charts linked in place, not pasted as static images
- 120+ chart types including waterfall and Mekko
- Chart Vizzard (preview) generates a new chart from a text prompt
- Also works in PowerPoint, useful for teams that use both
- Free tier available; Professional at $19/month
Limitations
- Free plan adds a watermark to exports
- No dedicated Dumbbell, Pareto, or Bar Race charts
- Team features (brand kits, collaboration) require the $69/month Teams plan
3. Chartbuddy
Best for Google Slides-only teams who never used think-cell
Chartbuddy is a Chrome extension purpose-built for Google Slides — it inserts waterfall, Mekko, and stacked bar charts natively from Google Sheets data, with no PowerPoint or Keynote support at all. It's a strong fit for teams that never used think-cell because they never touched PowerPoint, rather than teams migrating away from it.
Pricing: Free trial (10 sessions); €10/month or €100/year
Strengths
- Built only for Google Slides, with native chart insertion via a Chrome extension
- Live data sync from Google Sheets
- Transparent pricing from €10/month
Limitations
- Google Slides only — no PowerPoint or Keynote support
- No Gantt chart support
- No AI-assisted editing — style changes go through the extension's own menus
- No way to export just the chart — it only exists inside the Slides deck, so reusing it in a PDF, email, or anywhere else means screenshotting or downloading the whole slide
- Requires installing a Chrome extension rather than working in a plain browser tab
- Narrower chart type set than AECharts or Vizzlo
4. Native Google Slides charts
Best when your chart needs are genuinely basic
Google Slides can insert a chart from a linked Google Sheet with no add-on at all — Insert > Chart. It's free and updates when you refresh the linked sheet, but the chart type list is limited to bar, column, line, and pie. There's no waterfall, Mekko, Gantt, or any chart type consulting and finance decks typically need.
Pricing: Free
Strengths
- Completely free, built into Google Slides
- Direct link to Google Sheets — refresh the chart when the data changes
- No installation, no account beyond Google Workspace
Limitations
- No waterfall, Mekko, Gantt, or other advanced chart types
- Minimal styling control compared to a dedicated chart tool
- Not a real think-cell replacement for consulting or finance work
How to choose
- AECharts — need waterfall, Mekko, Gantt, or scatter charts and don't mind exporting as an image; browser-based, $12/month.
- Vizzlo — want the chart linked live inside the slide and also work in PowerPoint sometimes; 120+ chart types.
- Chartbuddy — team is Google Slides only and never touches PowerPoint; Chrome extension, €10/month.
- Native Google Slides charts — needs are genuinely basic bar, line, or pie charts; free, no install.