Sankey Diagram Template
Visualize flows, processes, and distributions with this animated Sankey diagram template. Show how values move between stages — from budget allocation to energy flows to user conversion funnels. Flows animate progressively, revealing connections and proportions.
Common Sankey Diagram Use Cases
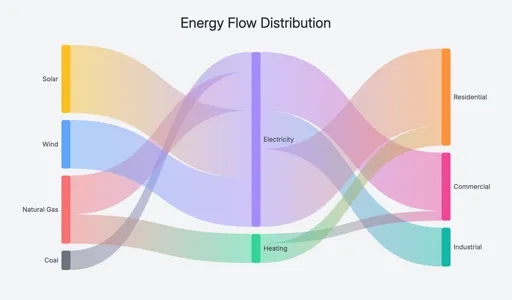
Energy Flow Analysis
Show how energy is generated, transformed, and consumed. Trace flows from sources (solar, wind, gas) through conversion to end uses (residential, industrial, transport).
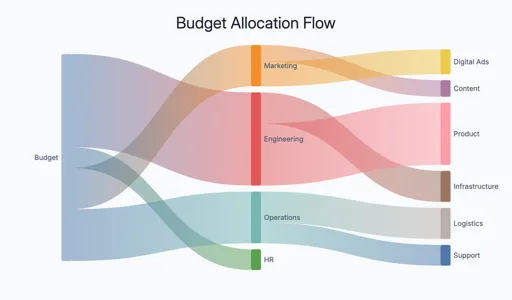
Budget Allocation
Visualize how money flows from revenue sources to departments, projects, or expense categories. Make budget discussions visual and intuitive for stakeholders.
User Flow & Funnels
Map how users move through your product — from landing page to signup to activation to purchase. Identify drop-off points and conversion bottlenecks visually.
Supply Chain & Logistics
Trace material flows from suppliers through manufacturing to distribution and retail. Show the full chain with proportional flow widths that reveal volume at each stage.
More Sankey Templates
Energy Flow
Visualize energy generation, transformation, and consumption flows.
Sankey Diagram FAQ
Create Your Sankey Diagram
Enter your flow data, customize colors, and export as an animated MP4 video. No design skills required.