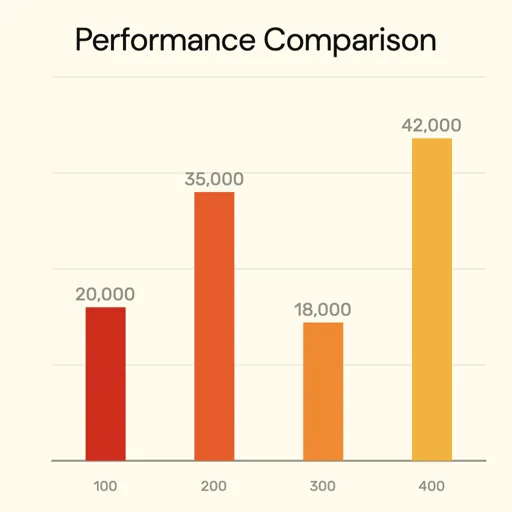
Sales Comparison Chart Template
Compare sales performance side by side with this animated bar chart template. Bars grow with smooth animation, making your data stand out in quarterly reviews, product comparisons, regional breakdowns, and team performance dashboards.
What You Can Compare
Products & SKUs
Compare sales across your product line. Instantly see which products drive the most revenue and which need attention. Great for product review meetings.
Regions & Territories
Visualize regional sales performance at a glance. Identify top-performing markets and territories that need more investment or support.
Quarters & Months
Track sales over time periods. Show quarter-over-quarter growth, seasonal patterns, and year-over-year comparisons with clear visual bars.
Sales Reps & Teams
Rank team performance and highlight top sellers. Use animated bars to reveal leaderboard-style comparisons in team meetings and all-hands.
More Bar Chart Templates
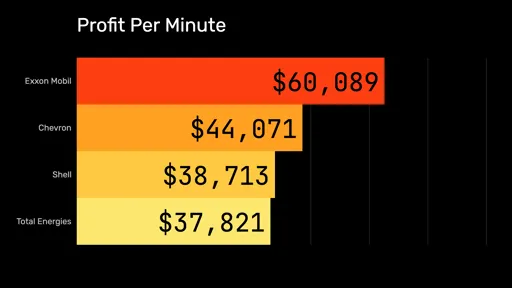
Profit Comparison

Monthly Active Users
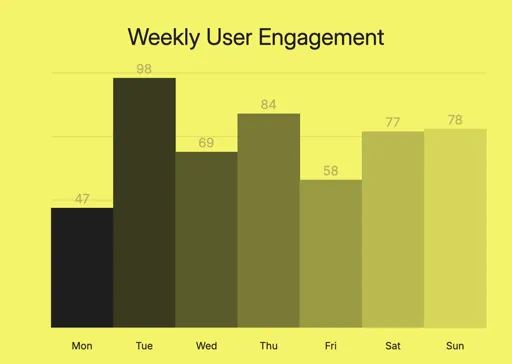
Weekly Engagement
Sales Comparison Chart FAQ
Create Your Sales Comparison Chart
Paste your sales data, customize the look, and export as an animated MP4 video. Ready in under a minute.