Valentine's Day Shopping Trends in 5 Charts
Valentine's Day is one of the biggest consumer spending events of the year. From candy and flowers to fine jewelry and experiences, billions of dollars flow through the economy every February.
We looked at the data behind the holiday and broke it down into 5 charts that tell the full story of how Americans shop for Valentine's Day.
1. Top 5 Gift Categories
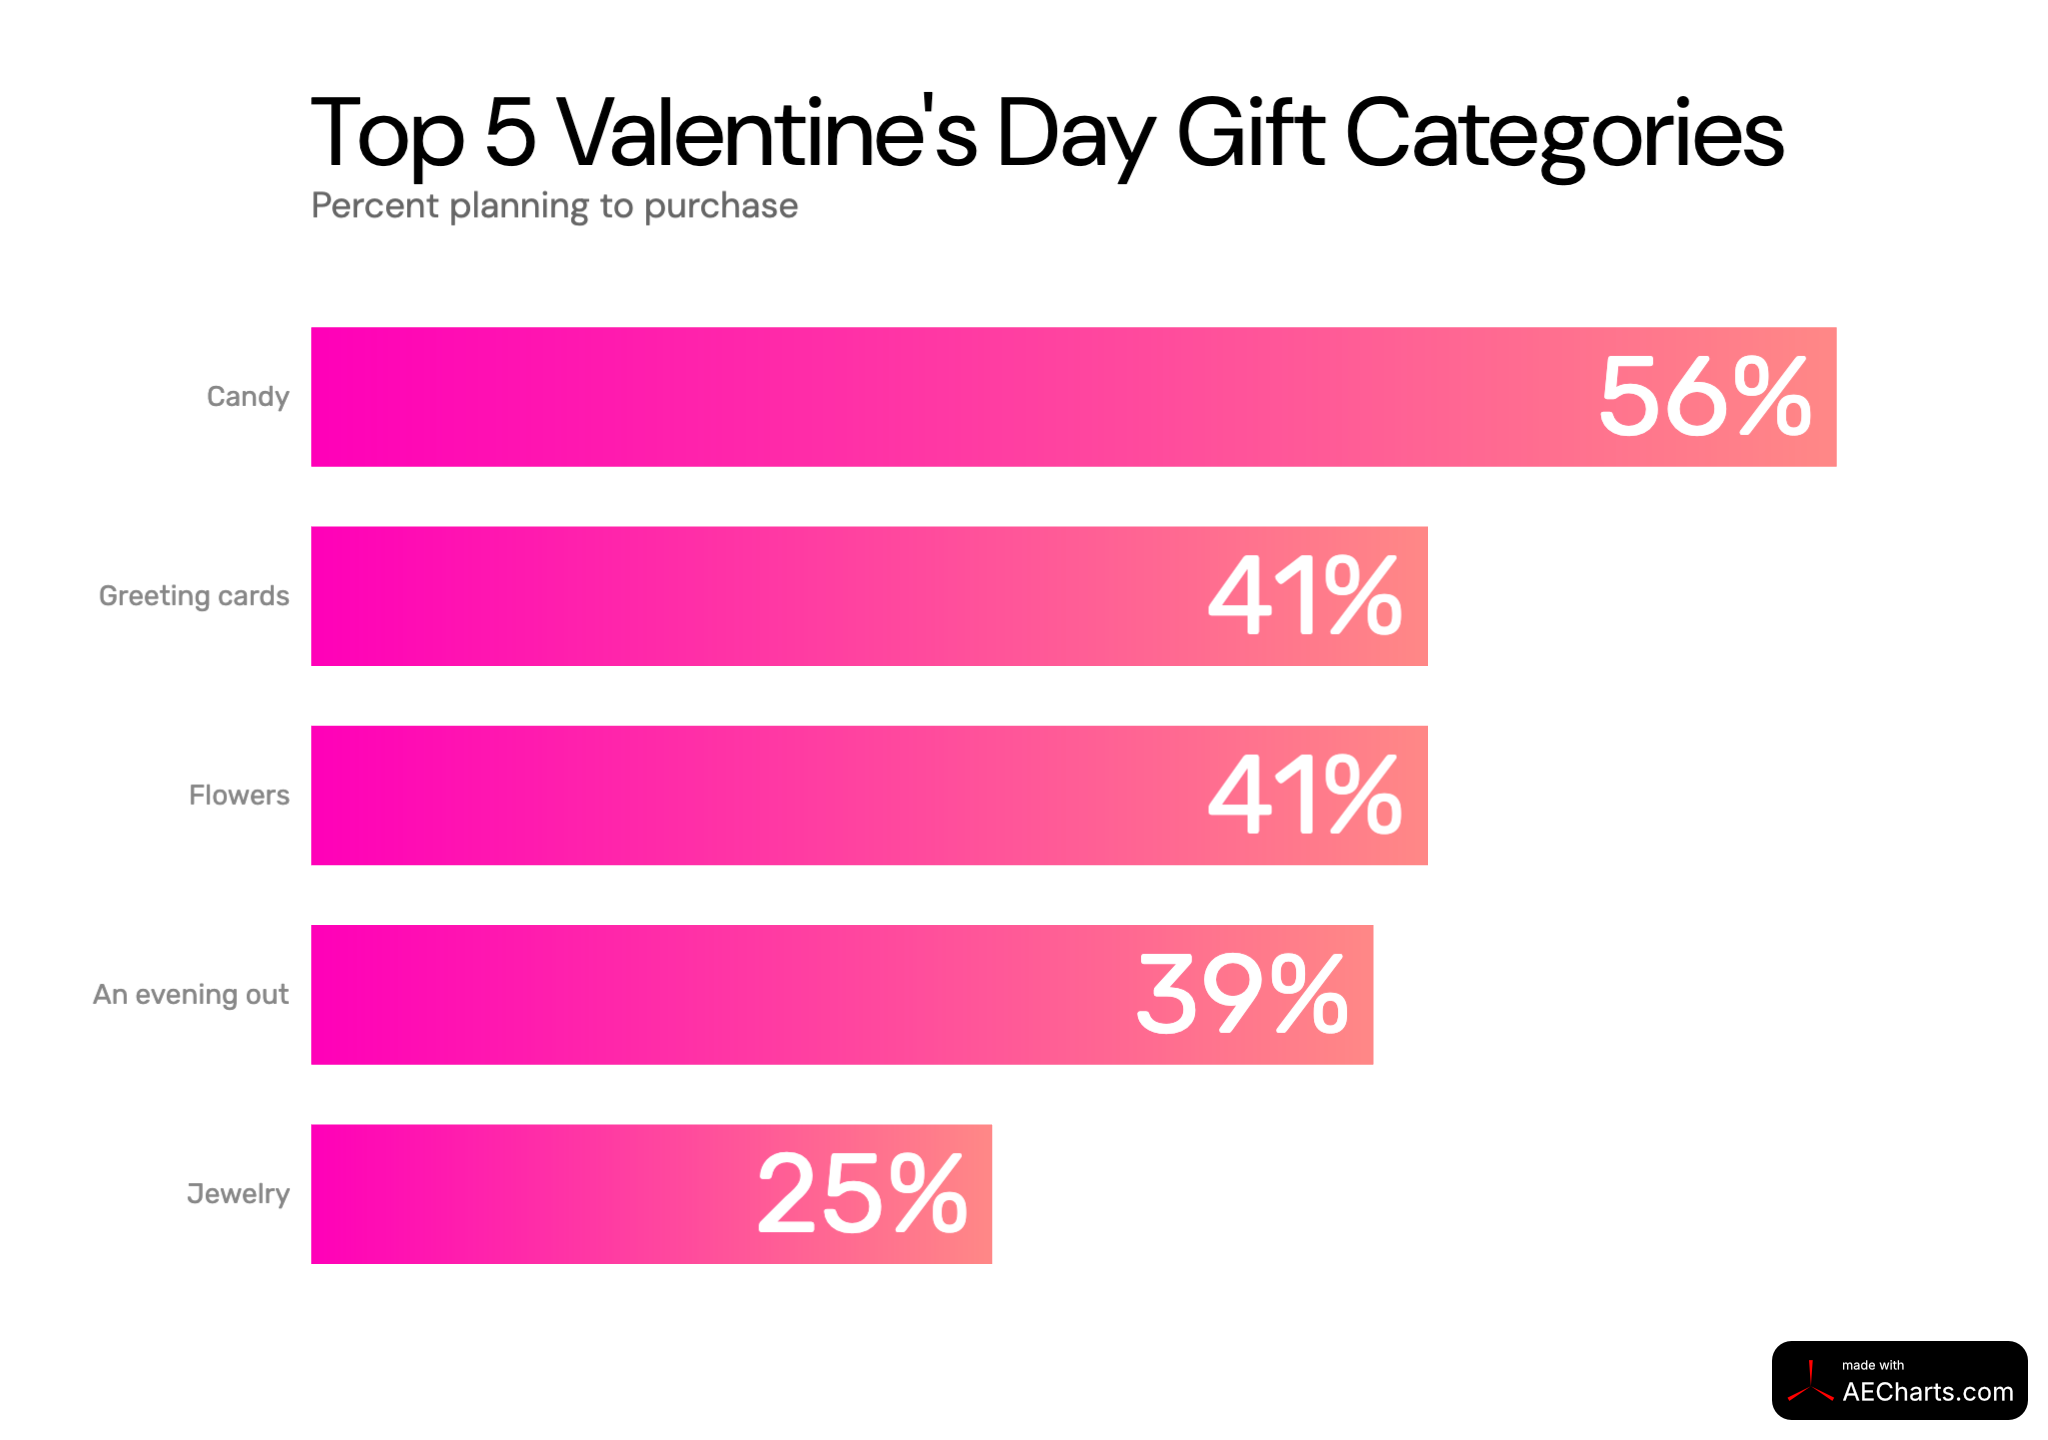
In this horizontal bar chart, candies continue to hold crown with 57% of gift buyers going for it. Their popularity comes from being affordable and easy to gift to anyone - coworkers, classmates, friends, or partners. Jewelry, while purchased by fewer people, drives the highest per-person spend.
2. Valentine's Day Spending Over the Years
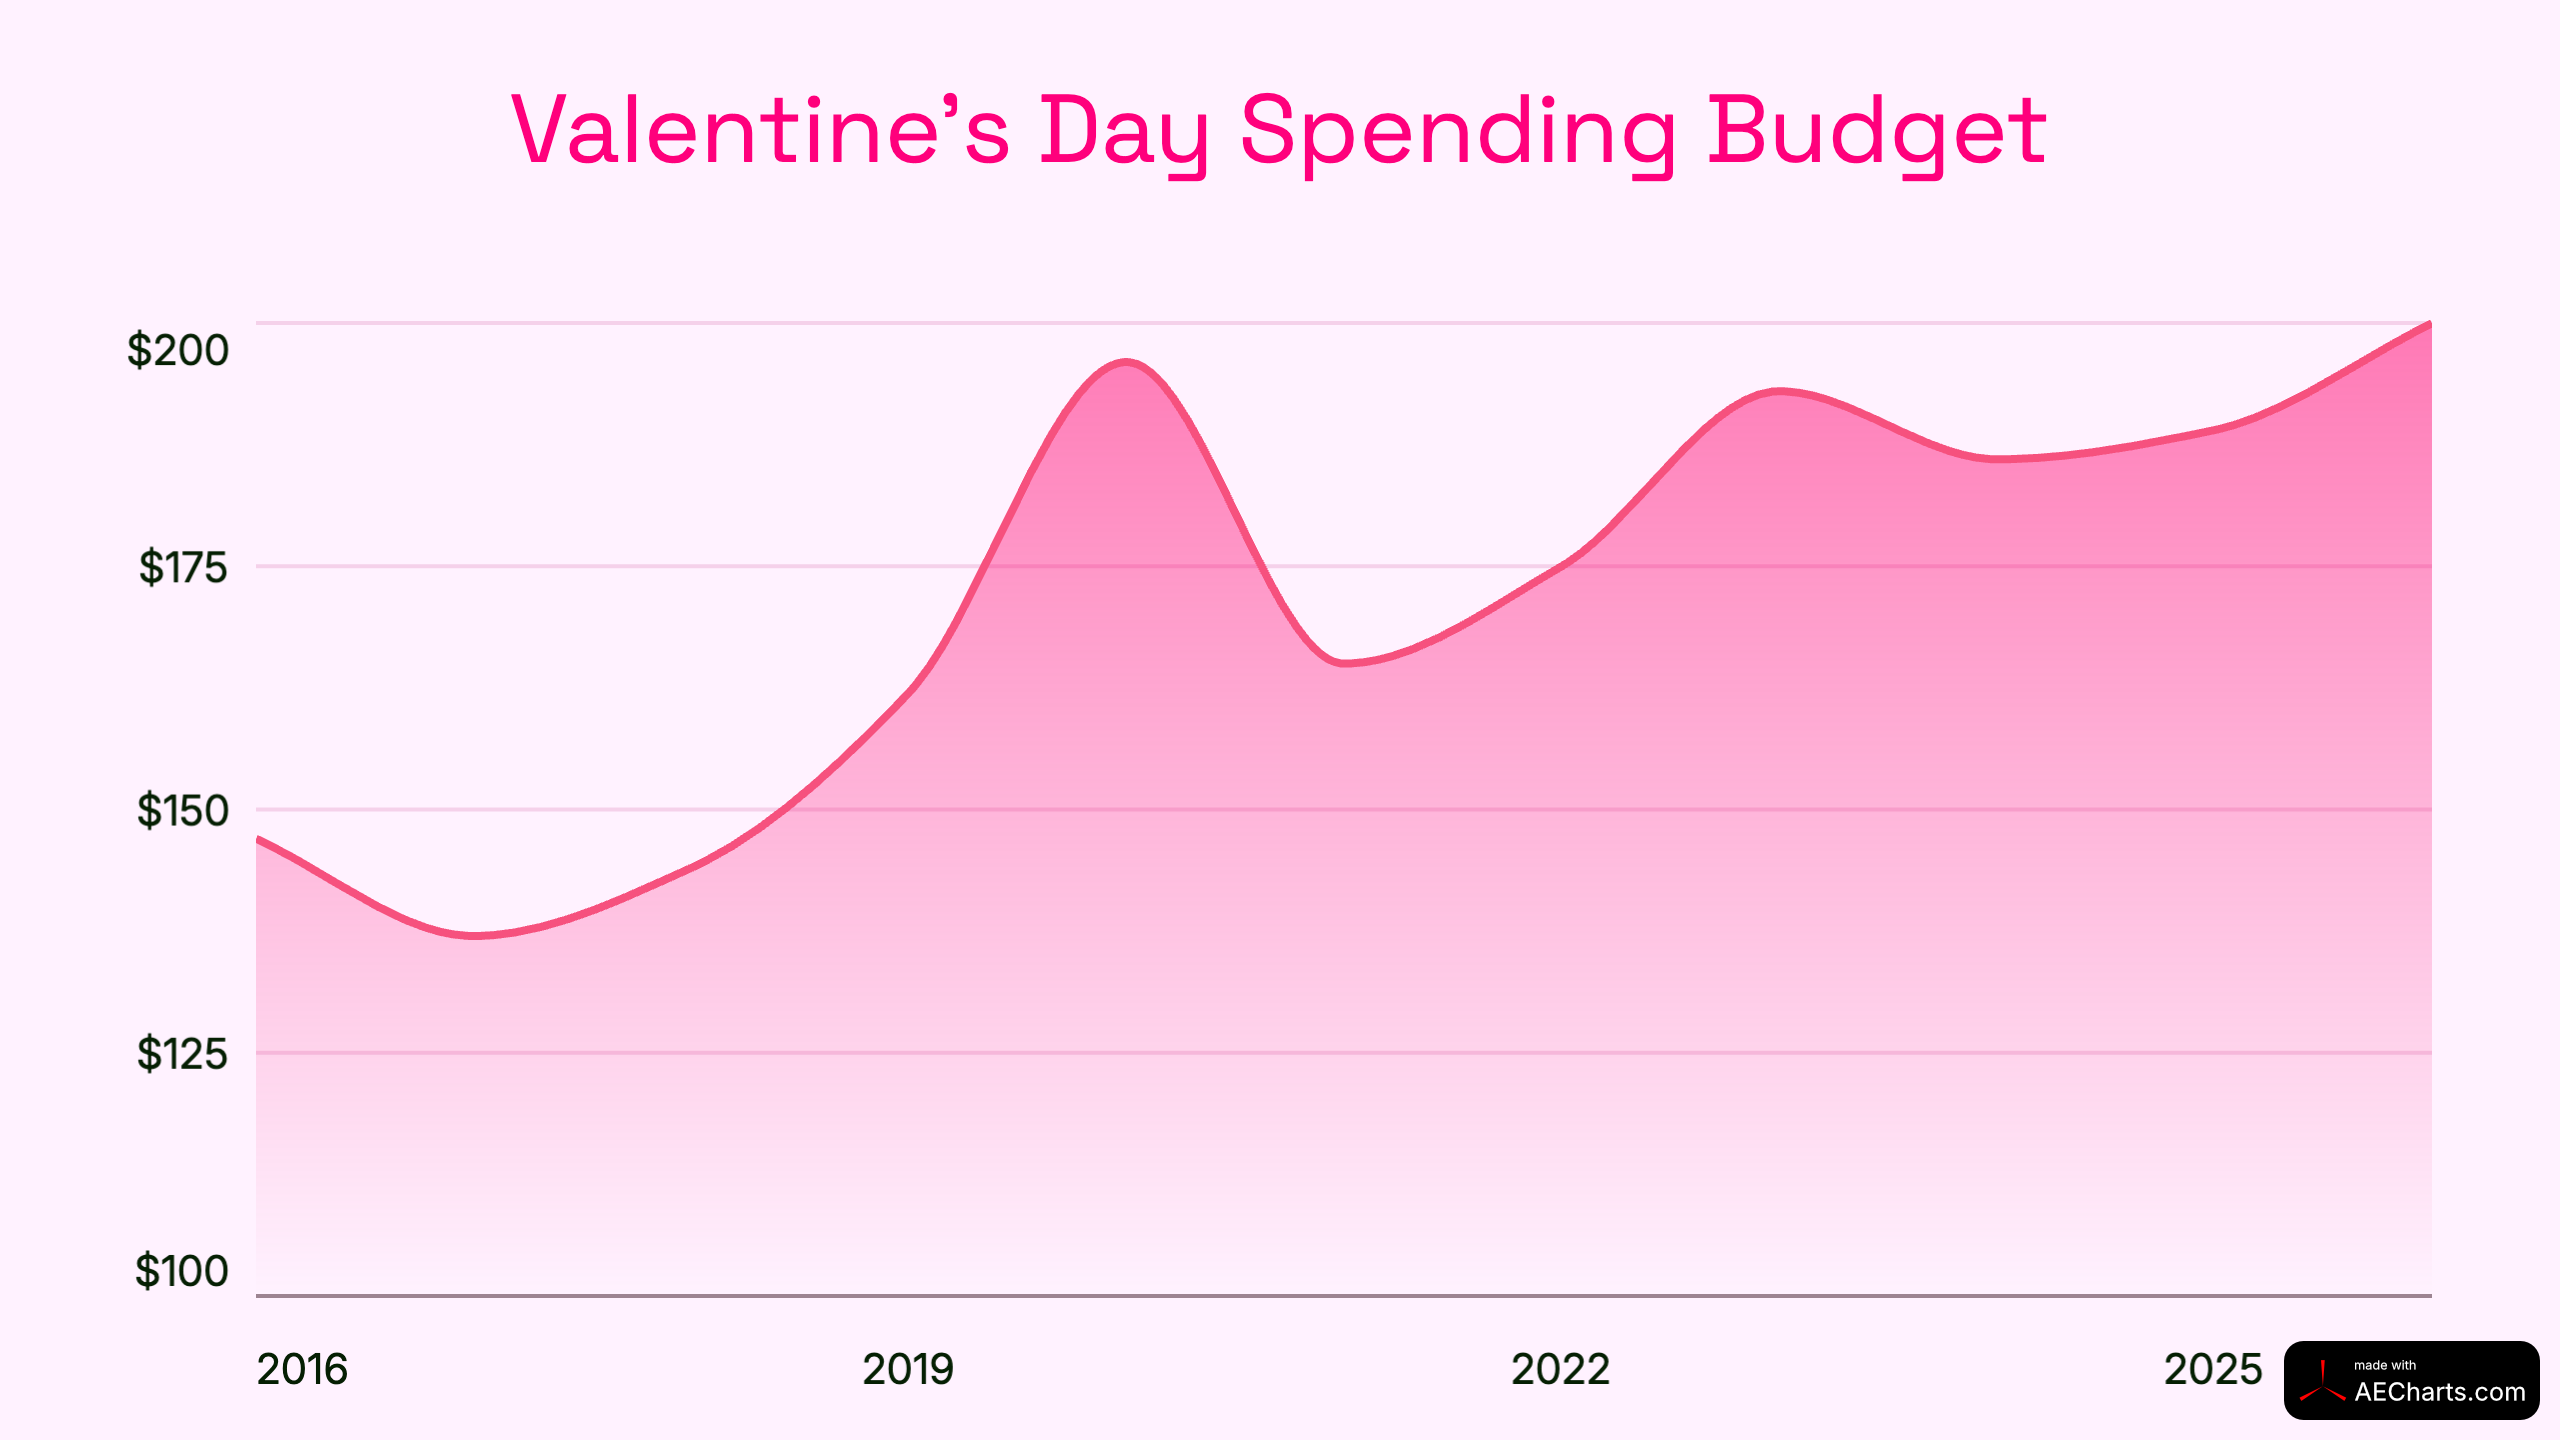
Total Valentine's Day spending in the U.S. has grown from $14.7 billion in 2010 to over $25.8 billion in 2024, despite a few dips along the way.
Key moments in the trend:
- 2020: Spending hit a high of 196$ per person, a record at the time
- 2021: Due to COVID it dropped a lot, as
- 2022-2026: A slow rebound to it's 2020 height
The overall trajectory as captured by the line chart is clear - Valentine's Day is getting more expensive, driven by inflation and a shift toward higher-value gifts and experiences.
3. Who Are They Buying Gifts For?
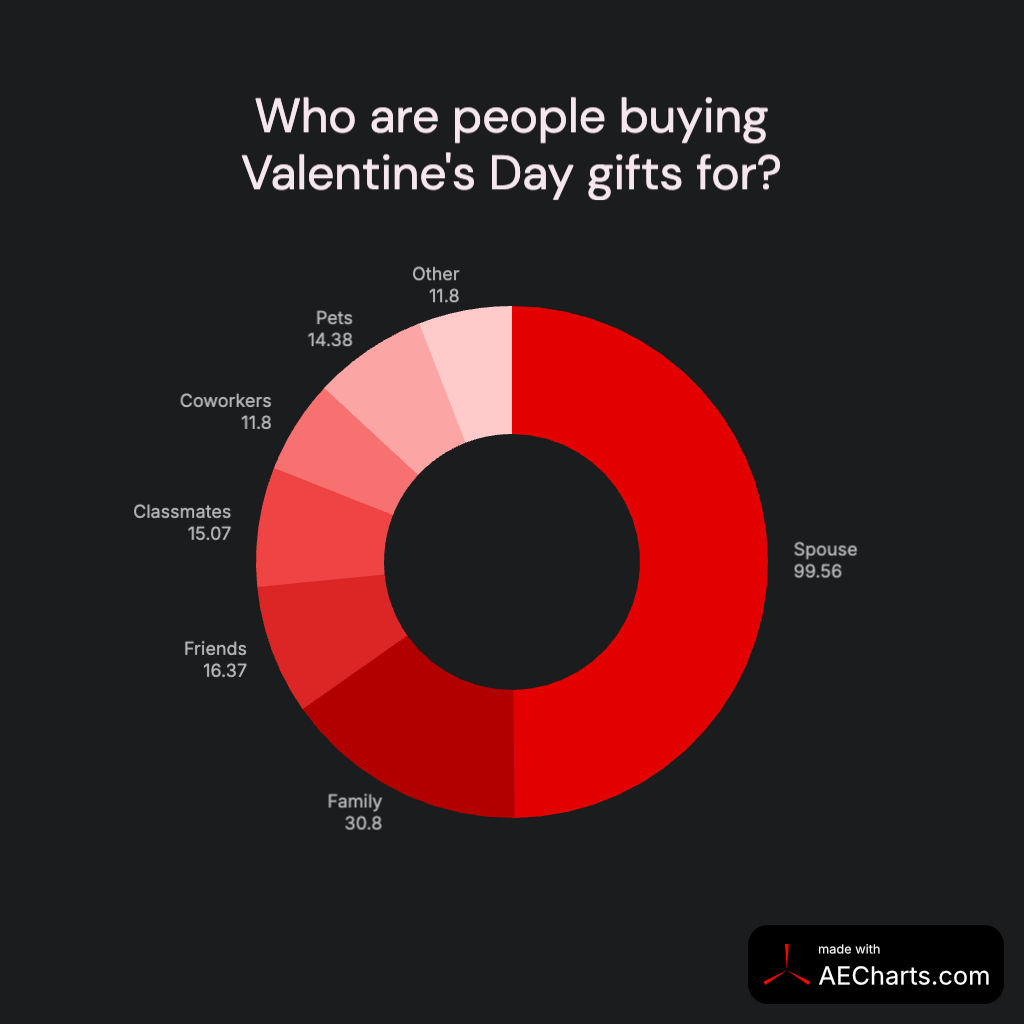
Valentine's Day isn't just for romantic partners. The pie chart shows gift-giving extends well beyond couples.
One of the more interesting trends is the rise of spending on pets - now approaching coworkers and classmates in popularity. Pet spending for Valentine's Day has grown steadily over the past decade, reaching approximately $2.1B in 2026.
4. Men vs Women: Who Spends More?
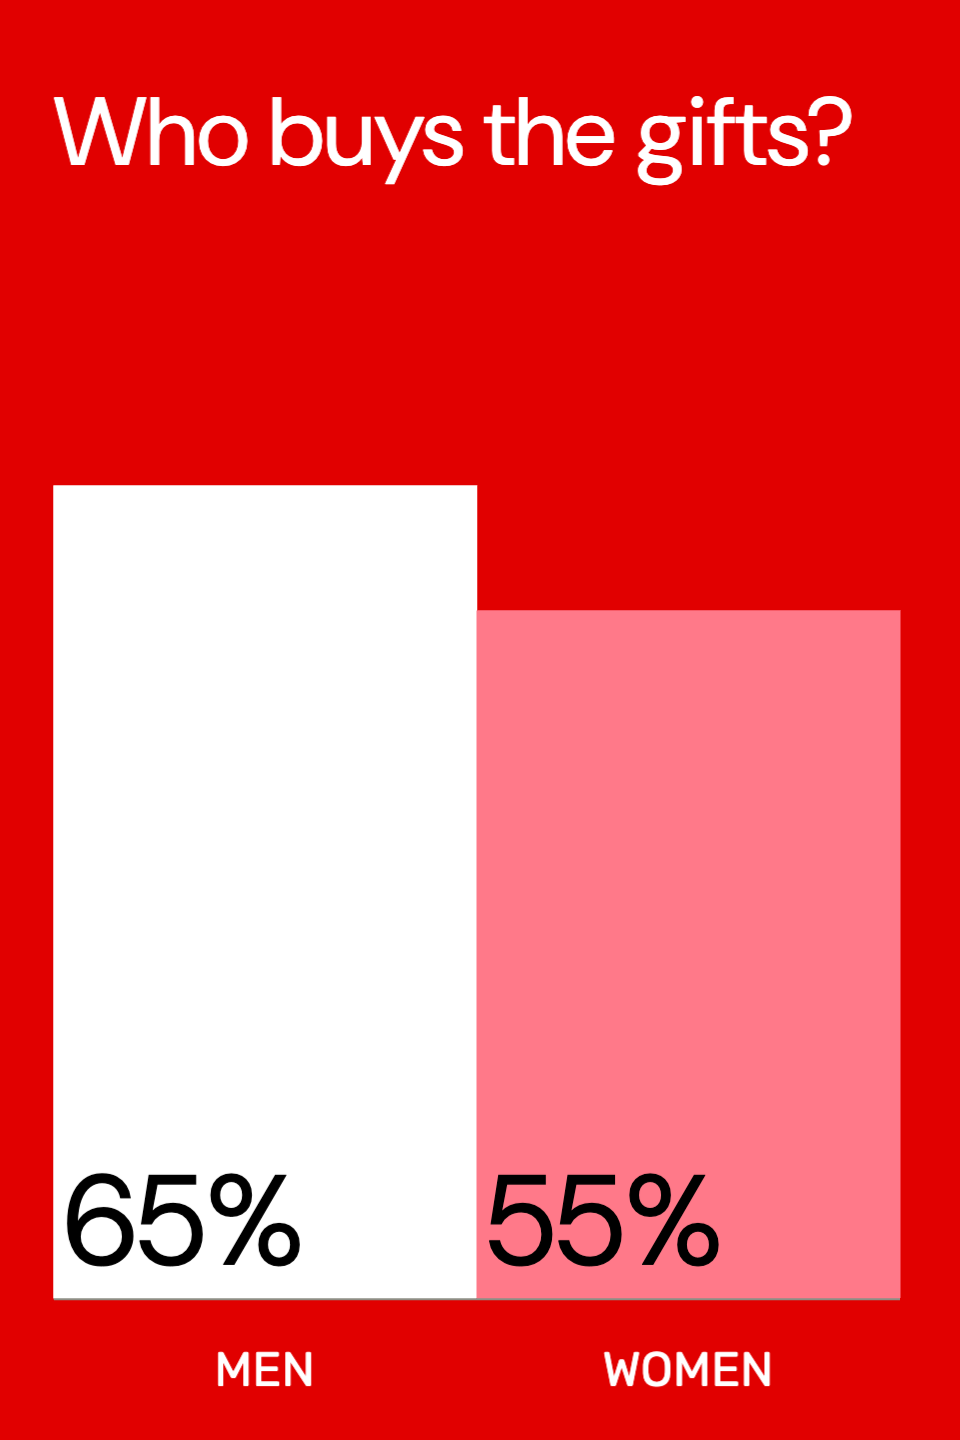
There's a significant gap in Valentine's Day spending between men and women.
- Men spend an average of $150 on Valentine's Day
- Women spend an average of $100
That's roughly a 1.5x difference highlighted by the bar chart above.
Men are far more likely to purchase jewelry, flowers, and evening-out experiences. Women tend to spend more on candy and greeting cards. The gap has remained consistent over the years, though both groups have seen spending increases.
5. What % of Americans Celebrate Valentine's Day?
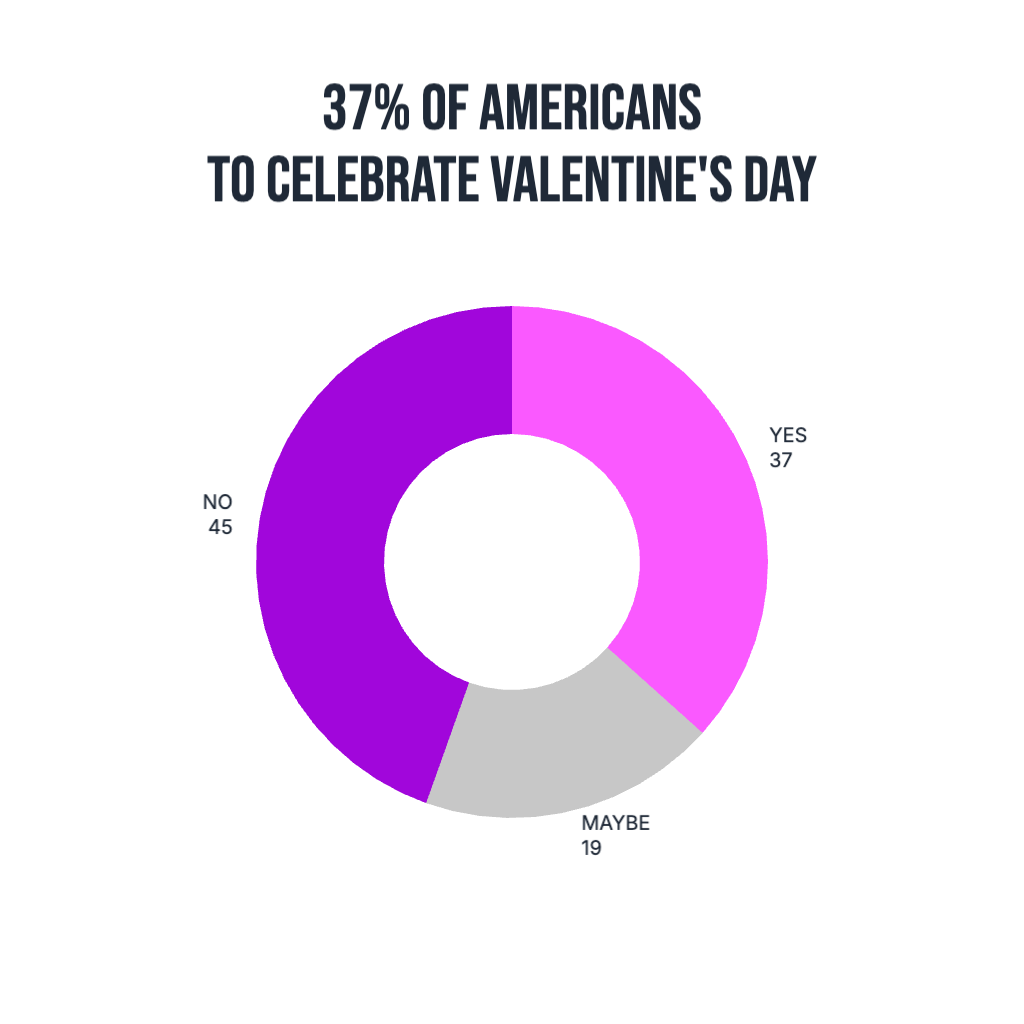
Not everyone celebrates Valentine's Day, and participation has actually been trending down.
Despite fewer people celebrating, total spending keeps rising - meaning those who do celebrate are spending significantly more per person. Average per-person spending has gone from around $103 in 2010 to roughly $185 in 2024.
This suggests Valentine's Day is becoming less of a universal holiday and more of a premium spending event for those who choose to participate.
Wrapping Up
Valentine's Day spending tells a story of shifting consumer behavior. Fewer people celebrate, but those who do are spending more. Gifts go far beyond romantic partners. And candy still reigns supreme.
All charts in this post were created using AECharts the fastest way to turn data into beautiful animated chart videos.