How to Create an Animated Pie Chart
An animated pie chart is one of the most effective ways to communicate proportions in video content.
It’s commonly used in marketing videos, social media posts, presentations, and explainers where static charts feel flat or boring.
In this guide, you’ll learn:
- What an animated pie chart is
- When you should use one
- How to create an animated pie chart manually in After Effects
- How to create an animated pie chart instantly using AECharts
What Is a Pie Chart?
A pie chart is a circular chart divided into slices, where each slice represents a percentage of a total.
Pie charts are best used when you want to show relative proportions, such as market share, budget allocation, or traffic sources.
What Is an Animated Pie Chart?
An animated pie chart adds motion to a traditional pie chart by animating how slices appear, grow, or transition.
This makes data easier to understand and significantly more engaging in video formats.
While many tools allow basic chart animations, most do not allow exporting the chart as a video, which is essential for content creators and marketers.
When Should You Use an Animated Pie Chart?
Animated pie charts are ideal when:
- Creating videos or reels for social media
- Explaining market share or distributions
- Enhancing presentations with motion
- Making data more engaging for non-technical audiences
If your final output is a video, animation is not optional—it’s expected.
How to Create an Animated Pie Chart in After Effects
After Effects provides full creative control but requires manual setup, calculations, and animation work.
Open After Effects and create a new project.
1. Create a Composition
After Effects usually prompts you to create a composition automatically.
If not, go to Composition → New Composition and choose your resolution, frame rate, and duration.
2. Creating the Pies
Select the Ellipse Tool.
Before drawing, set the fill to transparent and the stroke to your desired pie color.
This is important because the animation will rely on Trim Paths, which only affect strokes.
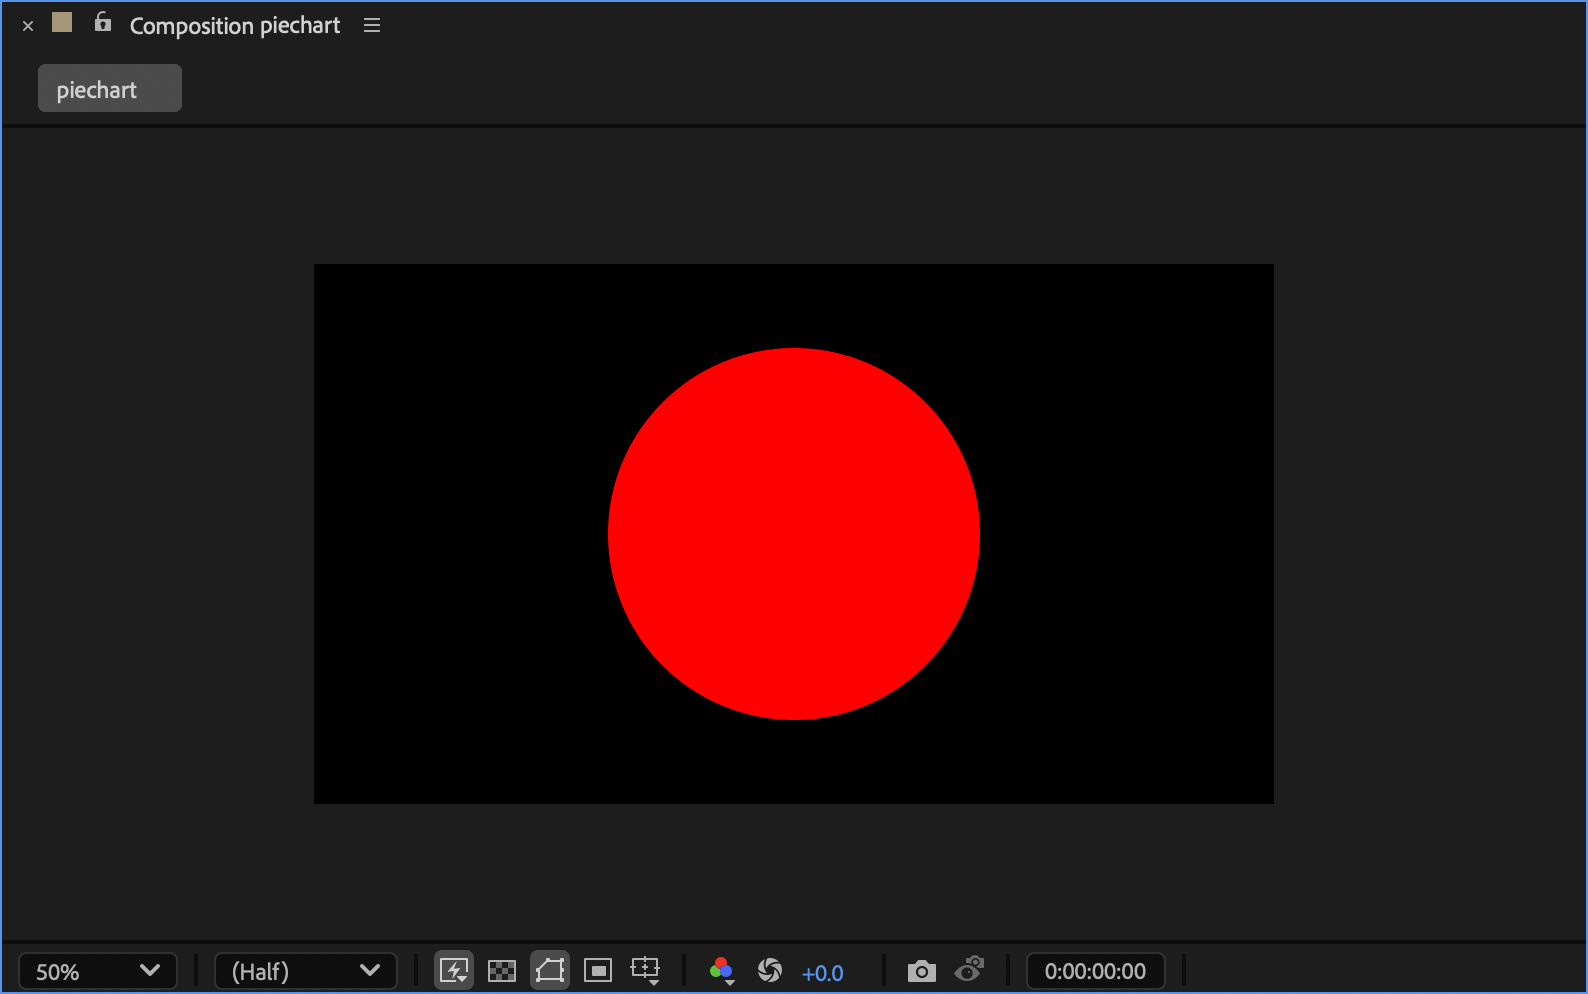
Draw an ellipse.
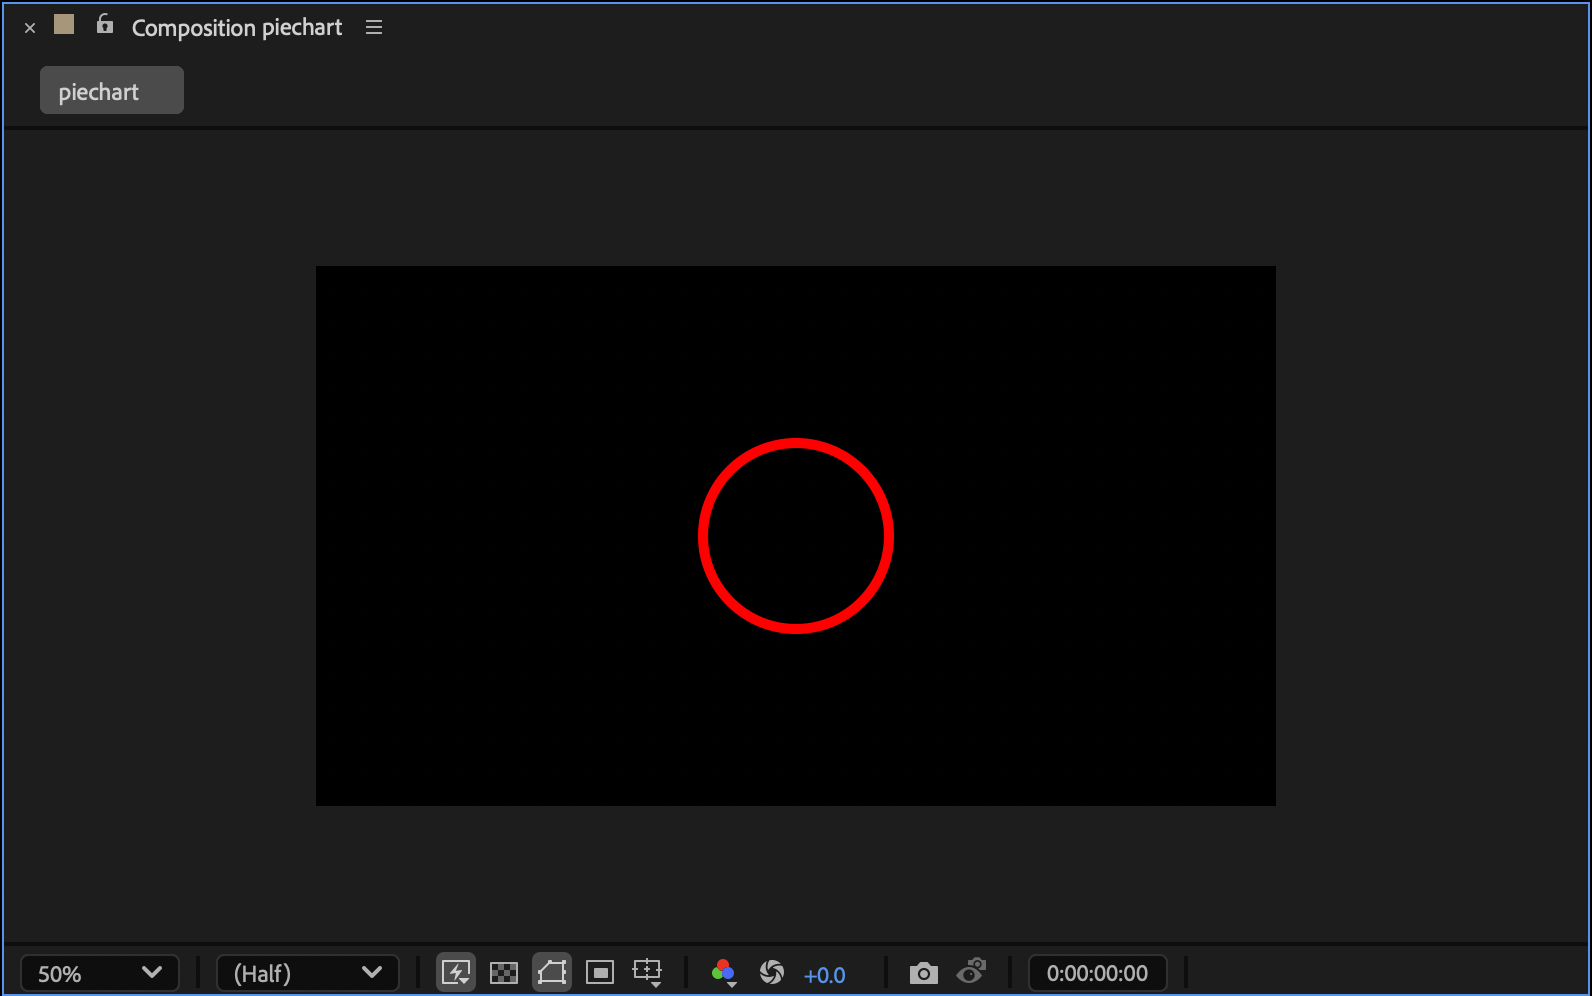
Increase the stroke width until the circle appears fully filled—there should be no hole in the center and no overflow beyond it.
3. Add a Trim Path
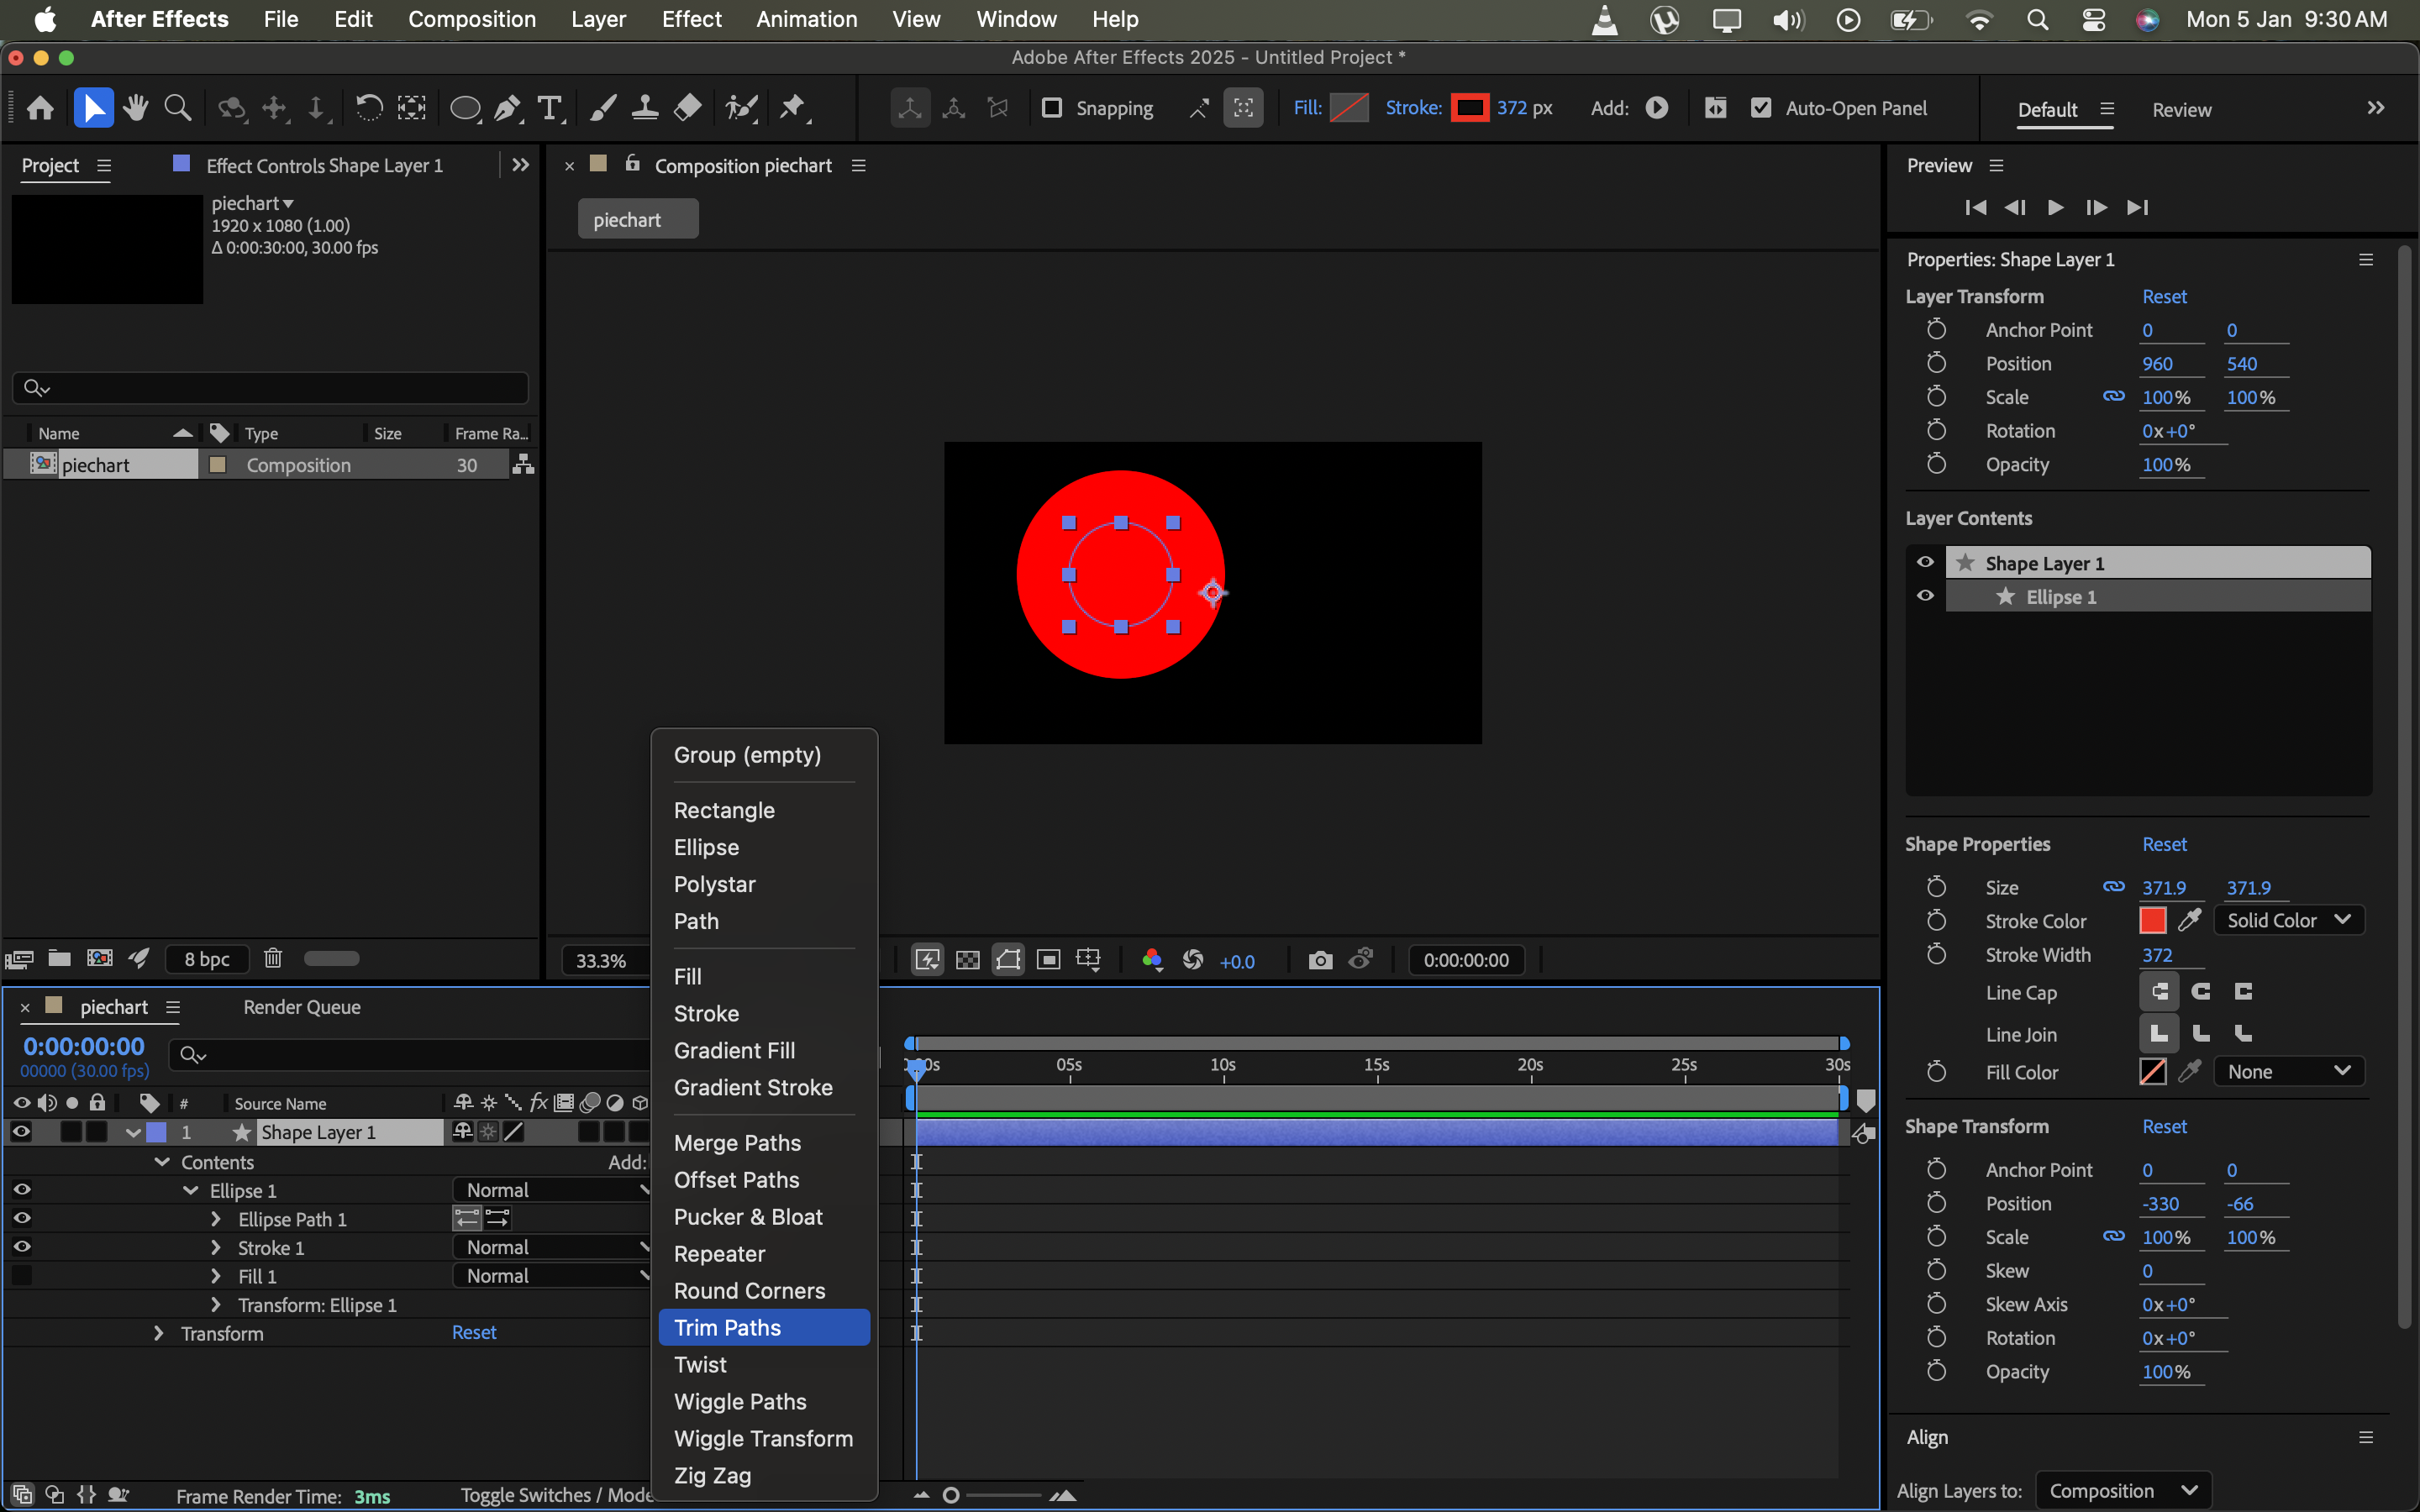
In the Shape Layer, click Add → Trim Paths.
You can now adjust the Start and End values to control the size and orientation of the pie slice.
4. Adding More Pies
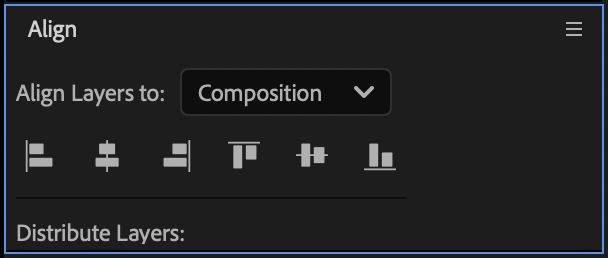
Center-align the shape layer both vertically and horizontally.
Duplicate the shape layer for each additional pie slice and change the stroke color for each one.
5. How to Find Start and End Percentages from Your Data
- Add all values together (e.g. 45 + 67 + 345).
- Divide each value by the total and multiply by 100 to get percentages.
- Use cumulative percentages to calculate Start and End values for each slice.
This step is manual and becomes tedious for larger datasets.
6. Animating the Pie Chart
At 1 second, set keyframes for both Start and End of the Trim Path for each slice.
Move the timeline to 0 seconds.
Set both Start and End values to 0% and add keyframes again.

When you play the timeline, the pie chart will animate smoothly into its final state.
Limitations of Creating Animated Pie Charts Manually
While After Effects is powerful, it has drawbacks:
- Manual percentage calculations
- Repetitive setup for every chart
- Time-consuming for simple data changes
- Requires animation and design knowledge
For most use cases, this workflow is overkill.
How to Create an Animated Pie Chart in AECharts
AECharts is built specifically for creating animated chart videos—without manual animation work.
1. Select a Template
Choose a pie chart template from AECharts.
Templates are designed for different content types such as finance, SaaS, sports, and news.
2. Enter Your Data
Each row represents one pie slice.
- First column: label
- Second column: value
Enter raw values—percentages are calculated automatically.
You can add or remove rows freely.
3. Customize the Style
Modify colors, chart title, fonts, labels, and background with simple controls—no animation setup required.
4. Export the Animated Pie Chart Video
Click Download Video to export your animated pie chart as a ready-to-use video file.
After Effects vs AECharts for Animated Pie Charts
| Feature | After Effects | AECharts |
|---|---|---|
| Video export | Yes | Yes |
| Manual animation | Required | Not required |
| Percentage calculation | Manual | Automatic |
| Time to create | High | Minutes |
| Design skills needed | High | Low |
Conclusion
If you need full creative control and custom motion design, After Effects can create an animated pie chart—but it’s slow and manual.
If your goal is to quickly create and export animated pie chart videos, AECharts is the faster and more practical solution.