Best Piktochart Alternatives in 2026
AECharts is the strongest alternative for animated data chart videos — 20+ chart types that animate to your data and export as native MP4 in seconds from the browser, with no render queue. Canva is the most popular general infographic tool with the largest template library. Visme and Infogram cover data-connected infographics for web and presentation output. Venngage is built for business reports. Adobe Express suits teams in the Adobe ecosystem.
Last verified May 2026 from official vendor pages.
| Tool | Pricing |
|---|---|
| Free tier (watermarked); Pro $19/month or $190/year | |
| Free tier; Canva Pro ~$15/month | |
| Free (limited); Starter ~$12.25/month; Pro ~$24.75/month | |
| Free (limited); Business $19/month; Team $67/month | |
| Free (watermarked); Premium ~$19/month; Business ~$49/month | |
| Free tier; Premium ~$9.99/month standalone, or included in Creative Cloud (~$54.99/month) |
Feature comparison
Based on publicly available information as of May 2026.
| Feature | AECharts | Canva | Visme | Infogram | Venngage | Adobe Express |
|---|---|---|---|---|---|---|
| MP4 video export | ✓ (native, seconds) | ✓ (limited animation) | Limited | ✗ | ✗ | Limited |
| Data-driven chart animation | ✓ (bars/lines animate to values) | ✗ | Partial (decorative transitions) | Partial | ✗ | ✗ |
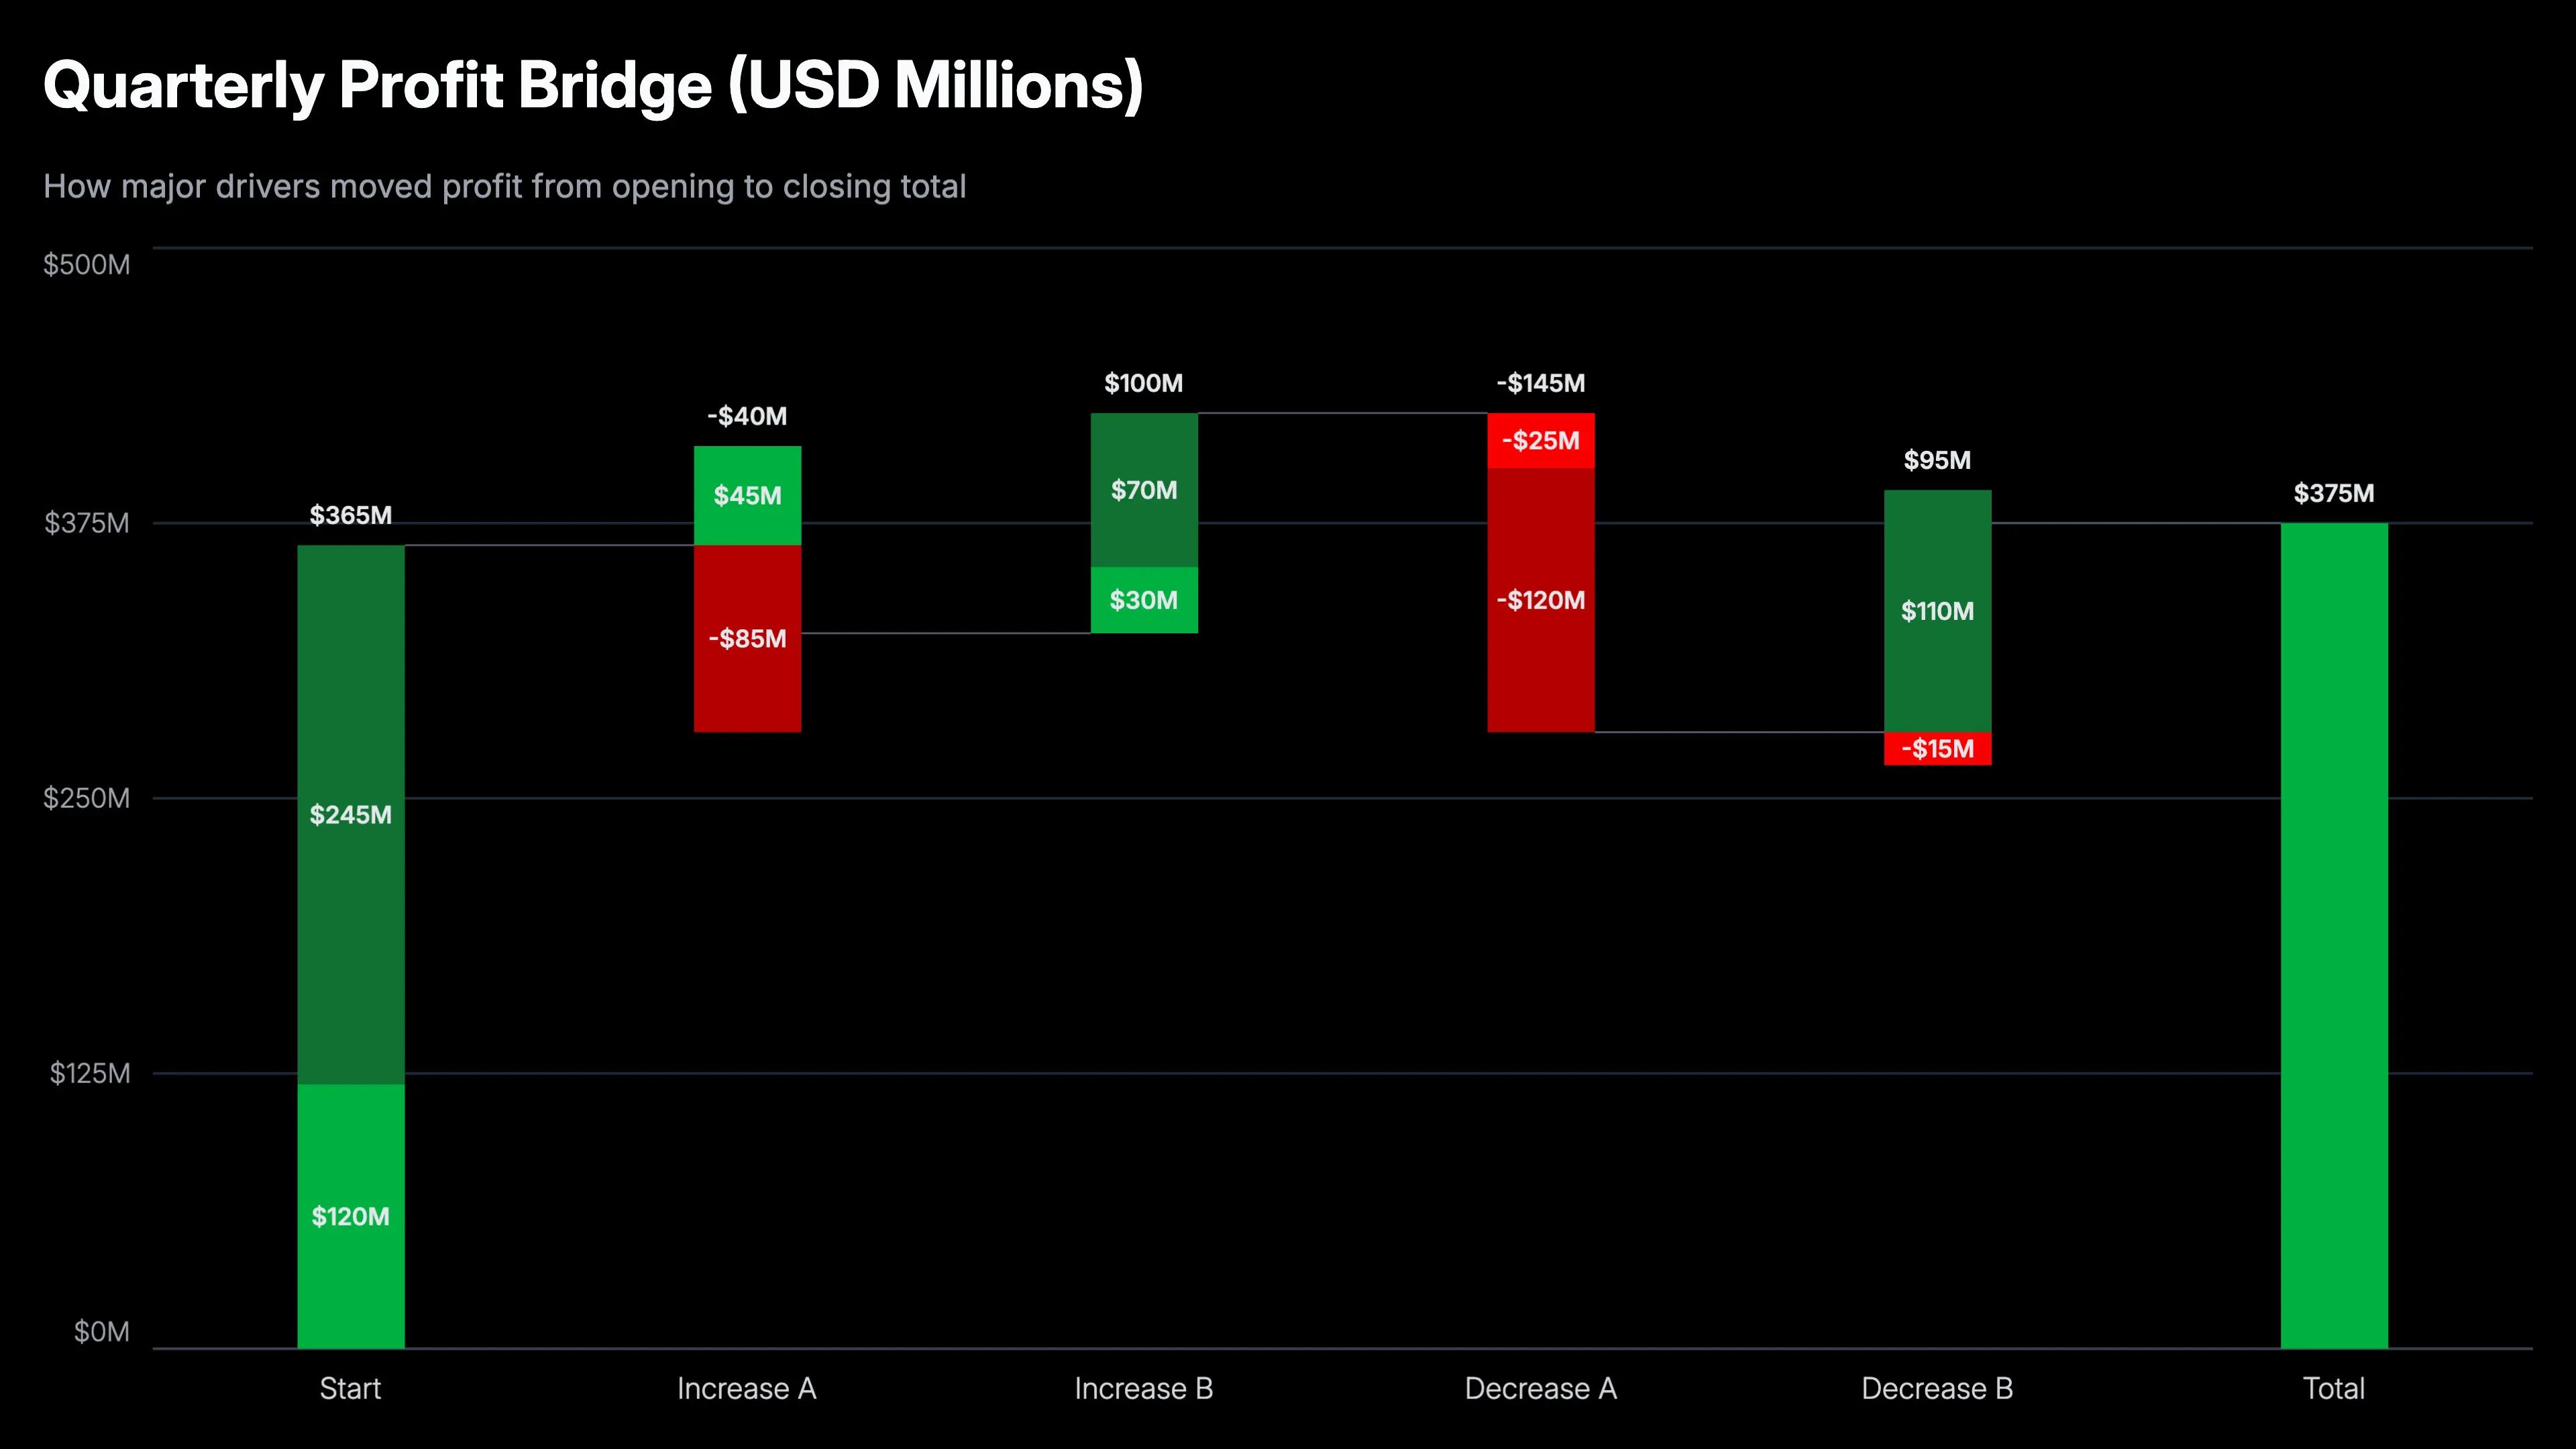
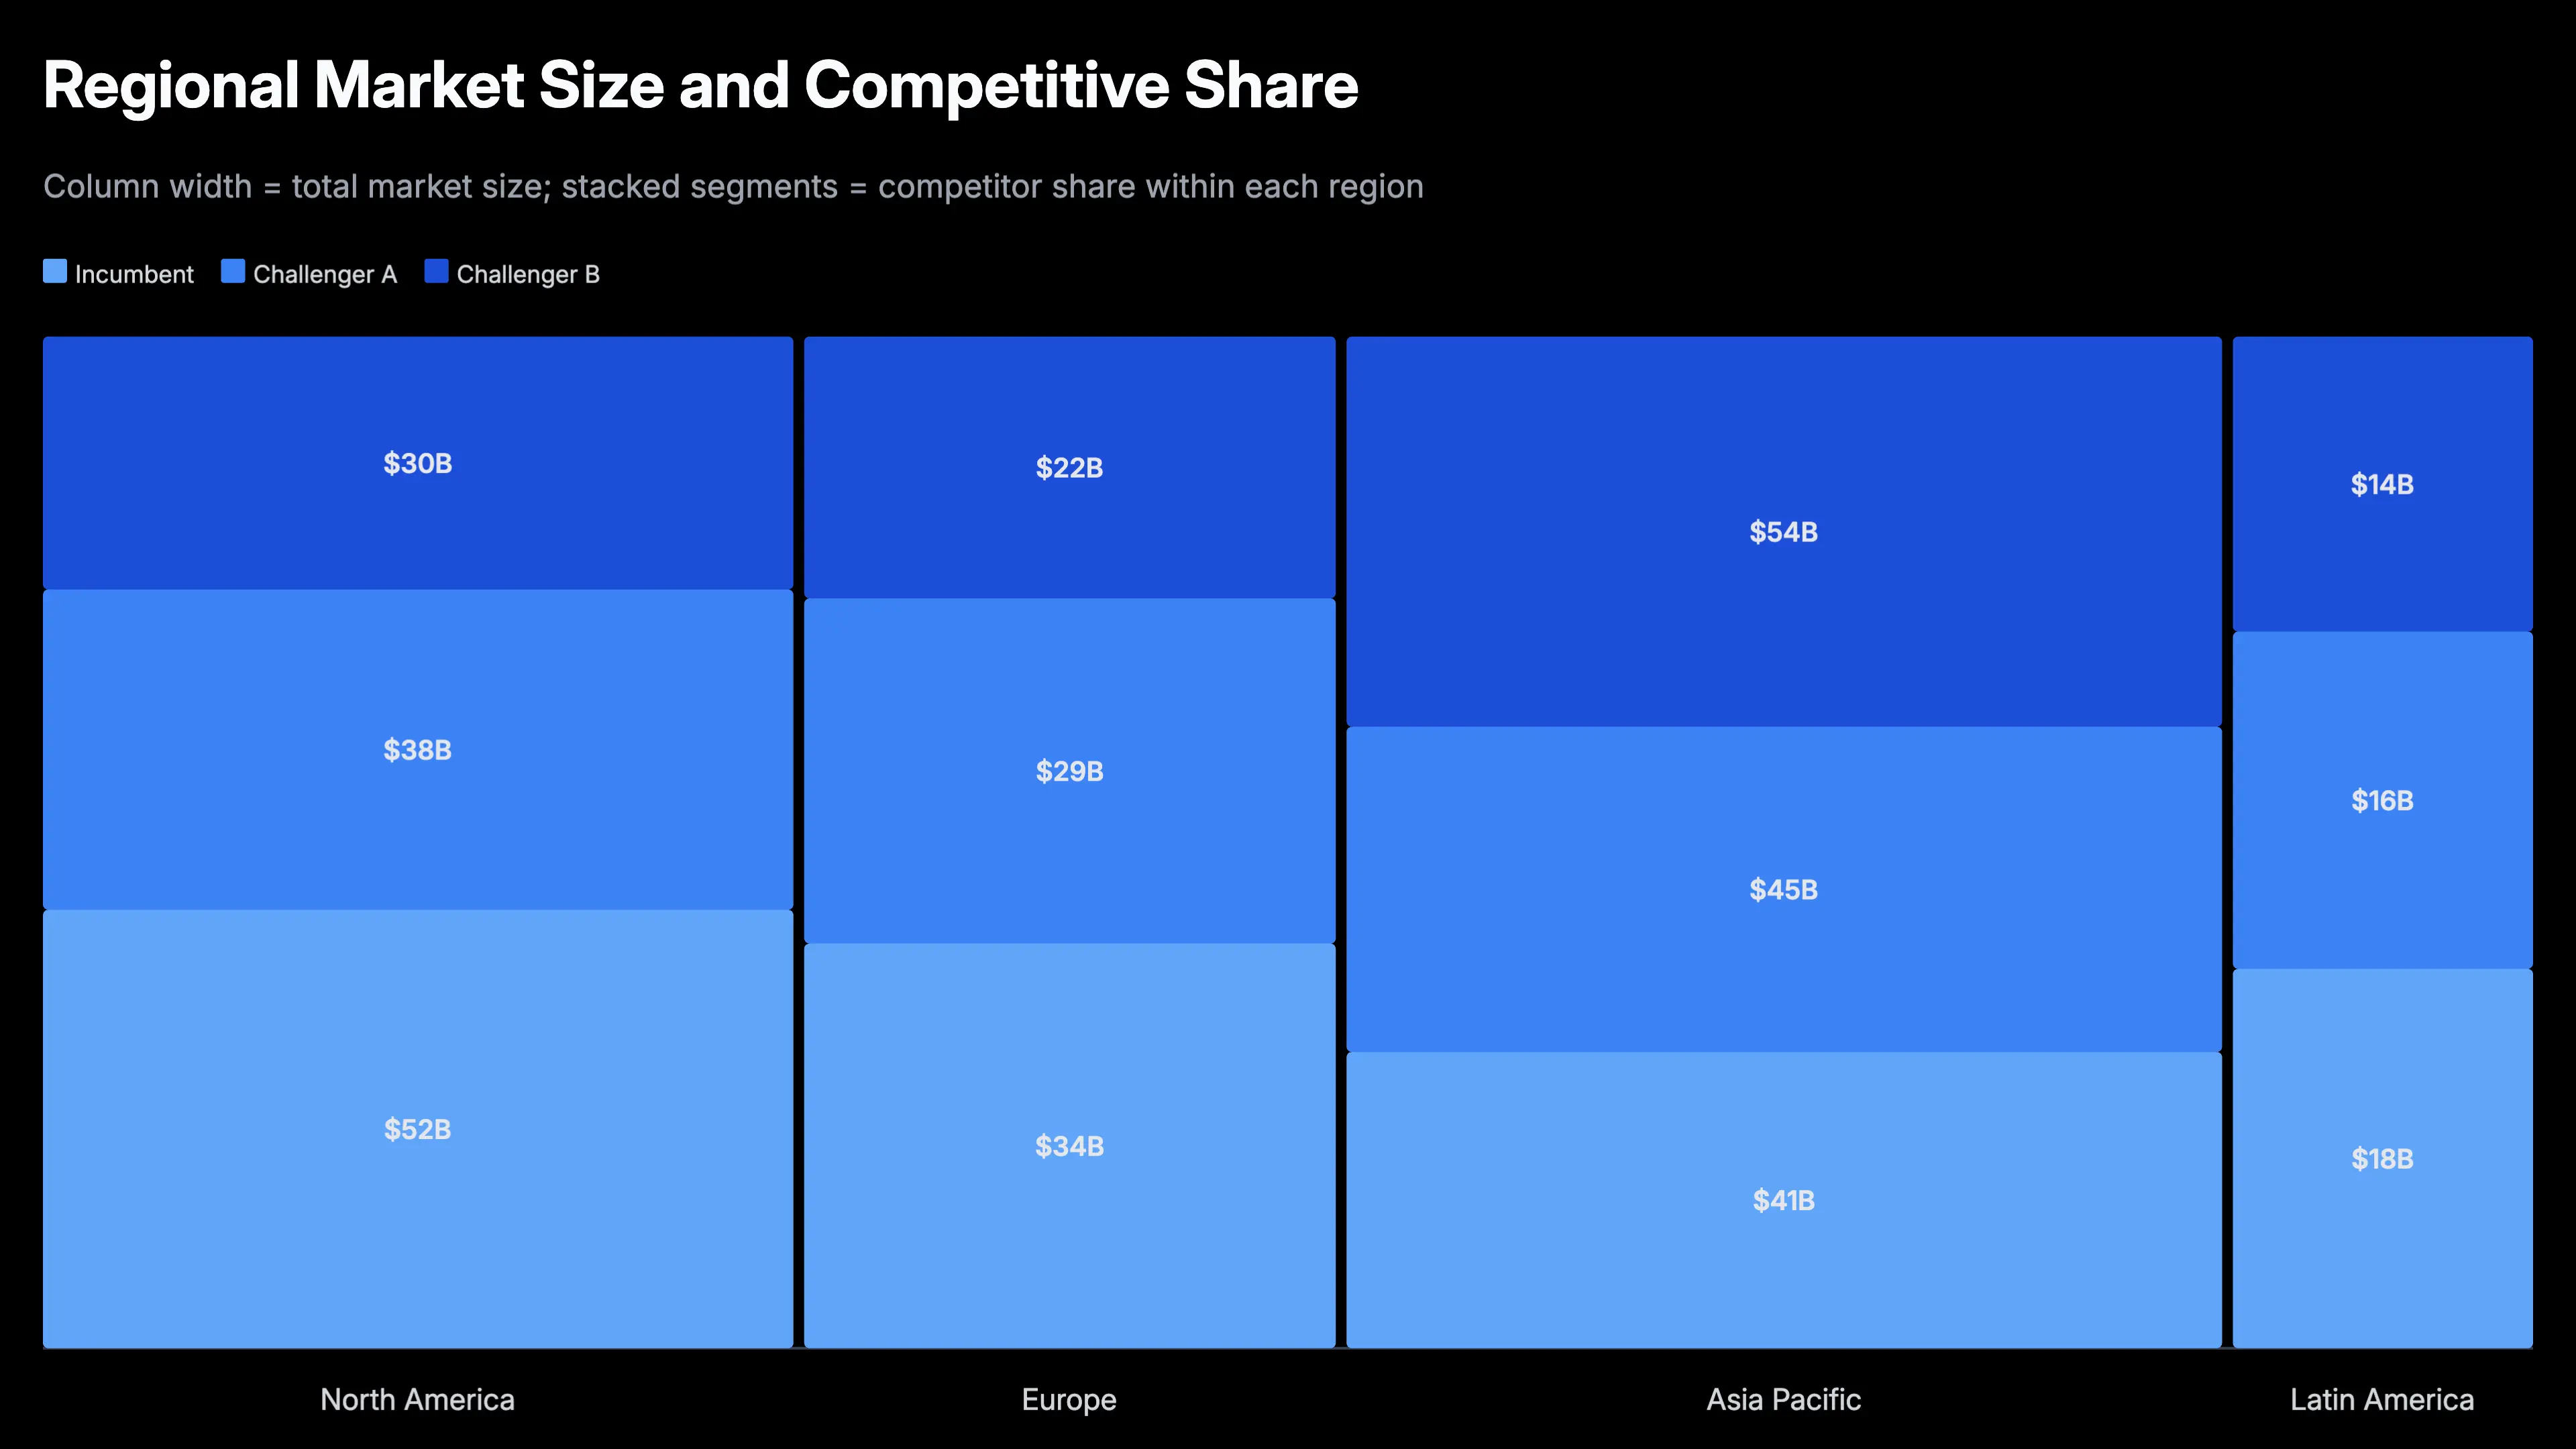
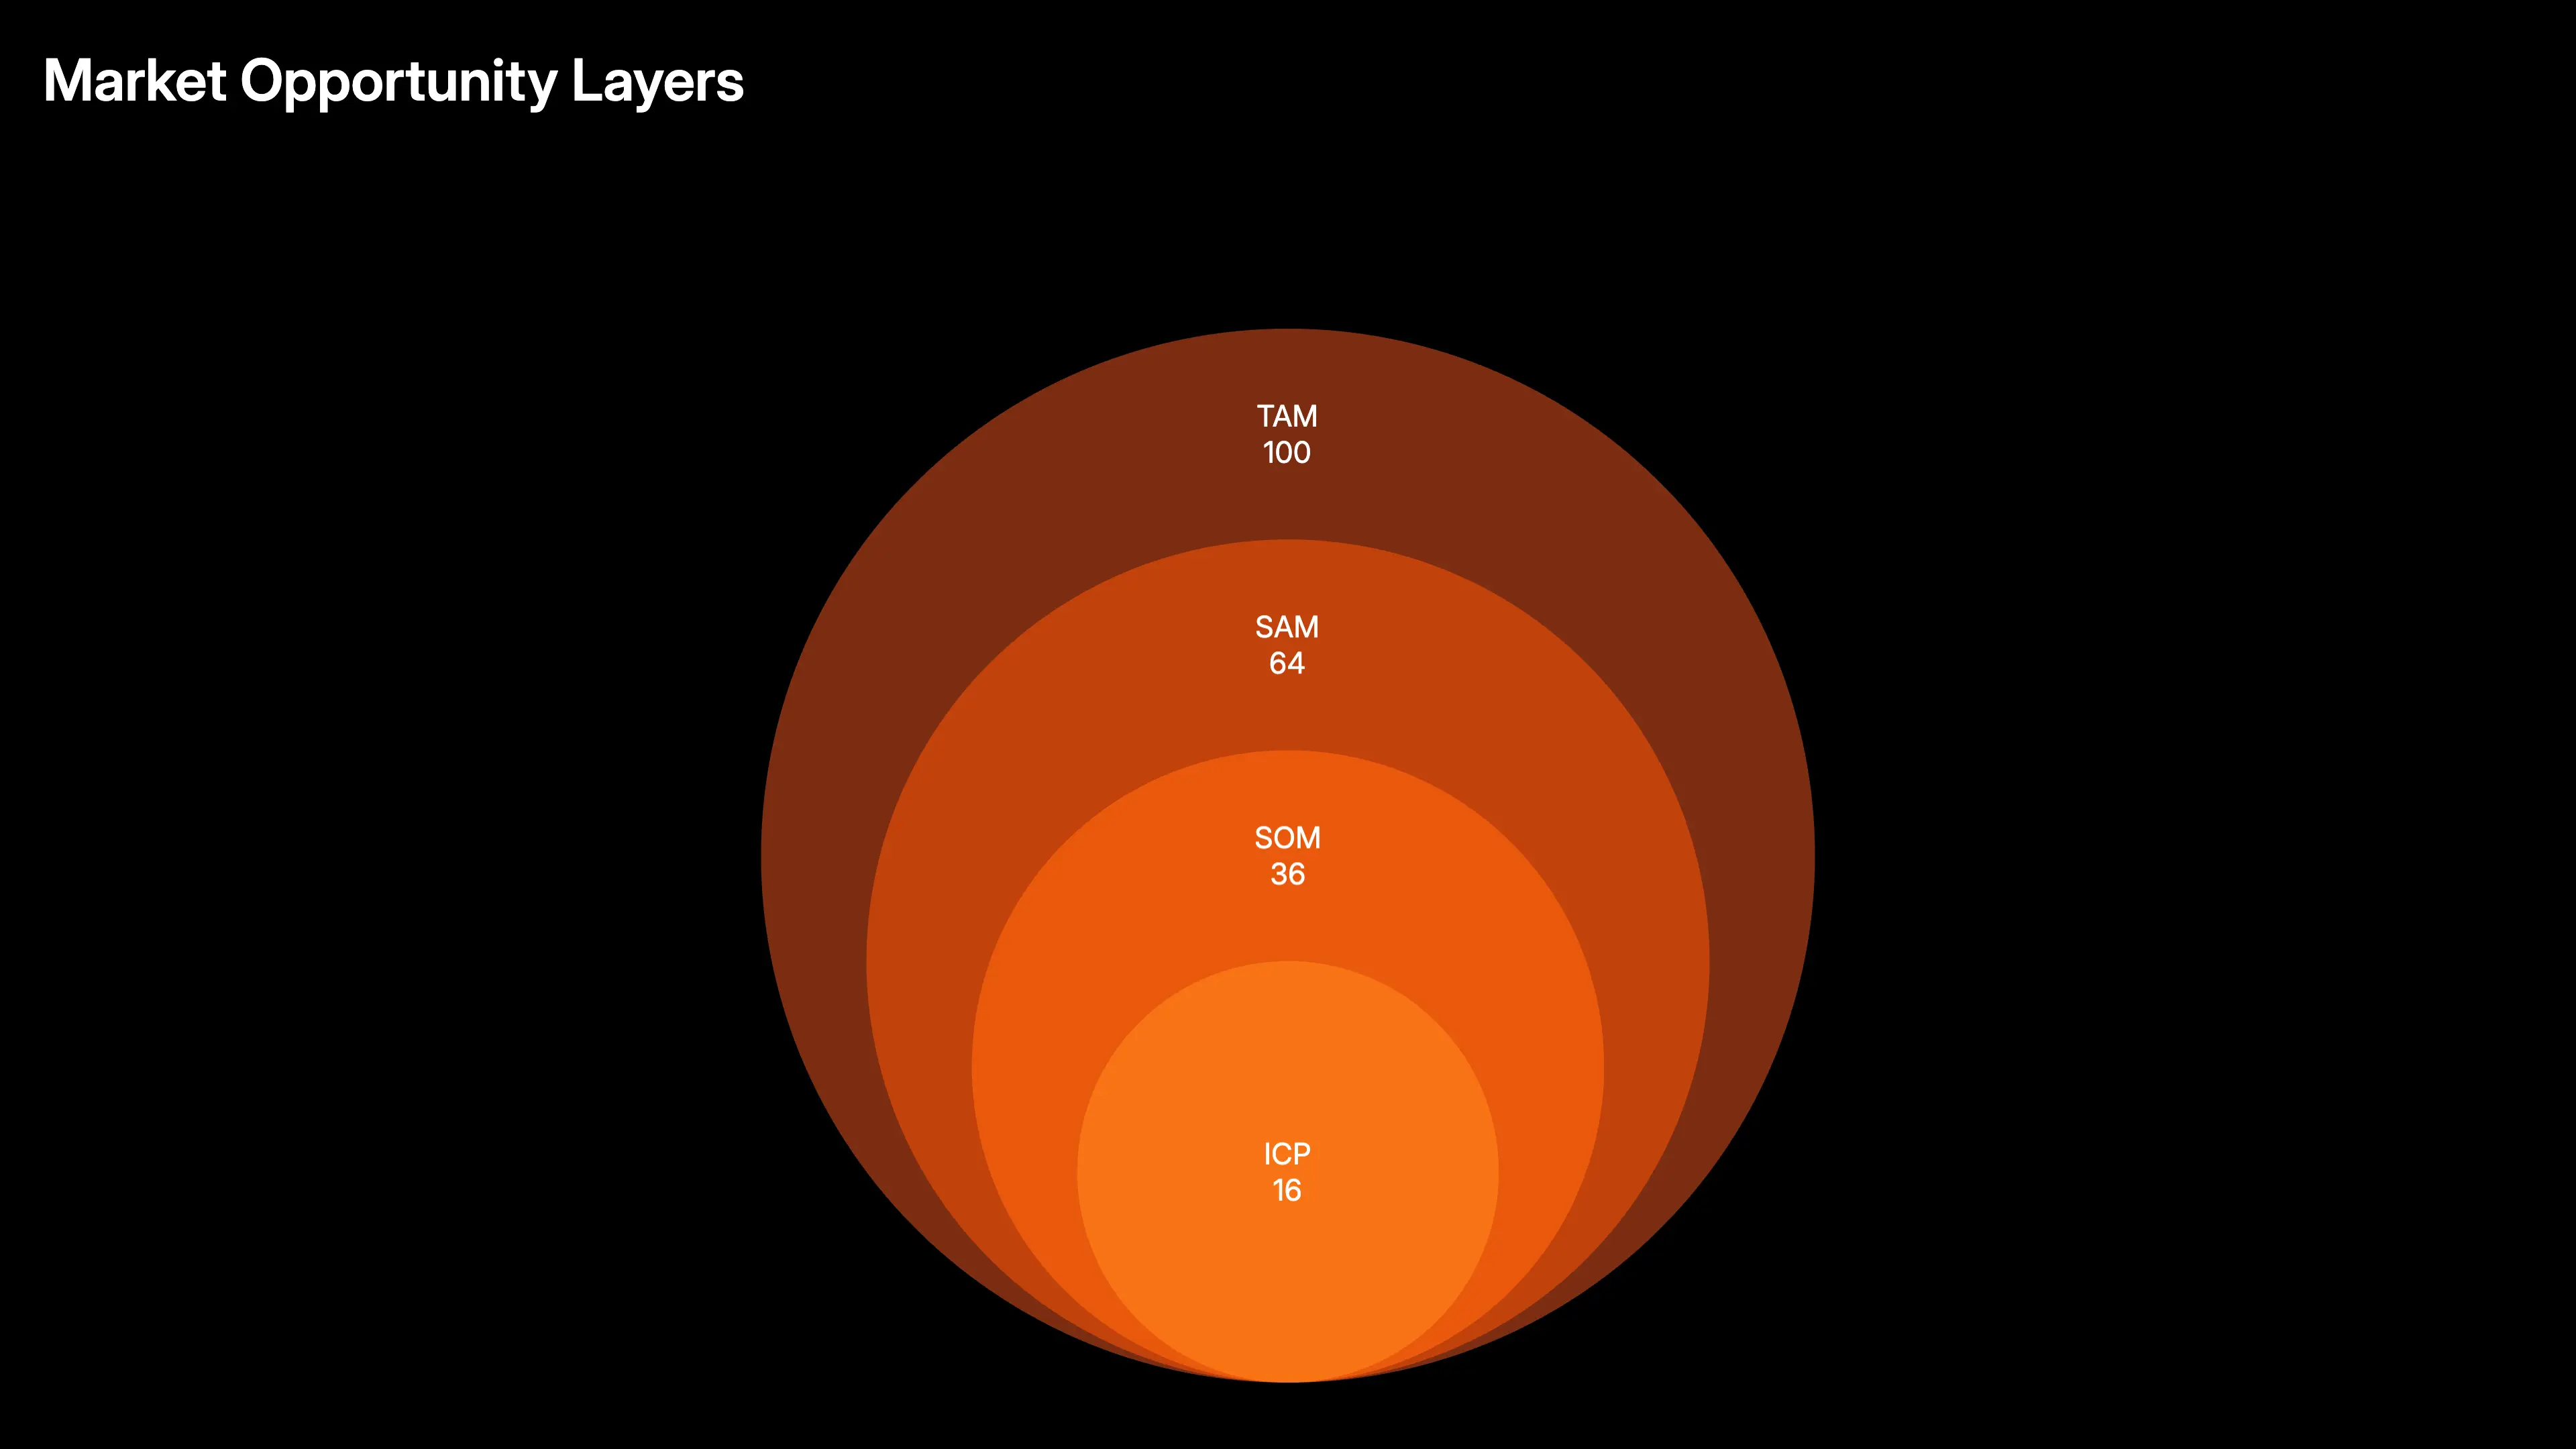
| Advanced chart types | Waterfall, scatter, treemap, heatmap, dumbbell, and more | Basic bar, line, pie only | Bar, line, pie, scatter, funnel | 35+ types including map charts | Basic bar, line, pie | Basic bar, pie only |
| Infographic templates | ✗ (charts only) | ✓ (thousands) | ✓ | ✓ | ✓ (business-focused) | ✓ |
| AI-powered design | ✗ | ✓ (Magic Write, image gen) | ✓ (AI design assistant) | Limited | ✓ (AI infographic generator) | ✓ (generative fill) |
| Browser-based (no install) | ✓ | ✓ | ✓ | ✓ | ✓ | ✓ |
| Free tier | ✓ (watermarked export) | ✓ (generous) | ✓ (limited) | ✓ (limited) | ✓ (watermarked) | ✓ |
| Starting price | $19/month | $15/month | $12.25/month | $19/month | $19/month | $9.99/month |
Detailed breakdown
1. AECharts
Best for animated data chart videos and MP4 export
AECharts is purpose-built for one thing Piktochart cannot do well: animated data charts that export as MP4 video. Paste your spreadsheet data, pick a chart type — bar, line, waterfall, scatter, treemap, and more — and the chart animates on screen and exports as a native MP4 in seconds, directly from the browser with no render queue. It is not a general infographic layout tool, but for animated data stories it produces results that Piktochart, Canva, and Visme cannot match natively.
Pricing: Free tier (watermarked); Pro $19/month or $190/year
Strengths
- Native MP4 export of animated chart videos in seconds — no render queue, no screen recording
- 20+ chart types with smooth data-driven animation: bar, line, pie, waterfall, scatter, treemap, heatmap, and more
- Data-driven: paste spreadsheet data directly — the chart auto-scales and animates to values
- Browser-based, no installation, works on Mac and Windows equally
- Free tier available; Pro at $19/month — no per-seat licensing
Limitations
- Chart-specific tool — not a general infographic maker with drag-and-drop text and icon layouts
- No stock photo library or freeform design canvas
2. Canva
Best general infographic and visual content tool
Canva is the most widely used general design tool, with tens of thousands of infographic, presentation, and social media templates. Its Animate feature adds motion to elements, but animation is preset and not data-driven — you cannot paste a dataset and have bars grow to represent values. Canva is the right Piktochart alternative when you need a broad range of visual content beyond charts, from social posts to reports to branded materials.
Pricing: Free tier; Canva Pro ~$15/month
Strengths
- Largest template library of any infographic tool — thousands of infographic and report layouts
- General design flexibility: layouts, icons, stock photos, text, brand kits
- AI image generation, Magic Write, and background removal built in
- Free tier is genuinely useful with a large feature set
- Familiar interface — very easy to learn
Limitations
- Animation is decorative — not data-driven; chart bars do not animate to actual data values
- No native MP4 export of data-driven chart animation sequences
- Chart types are basic — no waterfall, treemap, heatmap, scatter, or dumbbell
3. Visme
Best for data-driven infographics with mixed layout and chart content
Visme sits between a general infographic maker and a data visualization tool. It supports more chart types than Piktochart and lets you import data from Google Sheets and CSV. Its animation feature adds transitions to elements, but chart animation is not data-driven frame by frame — bars do not animate to exact data values the way AECharts does. It is a strong middle ground when you need infographic layouts that include data charts and some motion.
Pricing: Free (limited); Starter ~$12.25/month; Pro ~$24.75/month
Strengths
- More chart types than Piktochart: bar, line, pie, area, scatter, funnel, and more
- Infographic, presentation, and short-form video output in one tool
- Google Sheets and CSV data import for live-updating charts
- Brand kit support and team collaboration features
Limitations
- Chart animation is decorative transitions — not data-driven at the bar/point level
- No native MP4 export of animated chart video sequences
- Free plan is limited; paid plans start higher than AECharts
4. Infogram
Best for embeddable, live-data web infographics
Infogram is chart-first — it is built for data visualization with some infographic layout capability. Charts update live from connected data sources and embed cleanly in websites and dashboards. The focus is web publishing and live data rather than video export. It is the right pick for teams publishing data stories, live dashboards, or data journalism online rather than making downloadable videos.
Pricing: Free (limited); Business $19/month; Team $67/month
Strengths
- Strong data connectivity: CSV, Google Sheets, and live data feeds
- Embeds in websites with live data updates — charts refresh when the source updates
- 35+ chart types with a data-first editing flow
- Team collaboration and multi-user workspaces
Limitations
- No MP4 export of animated chart videos
- Design flexibility is more limited than Canva or Visme
- Pricing scales by seat and can get expensive for larger teams
5. Venngage
Best for business reports and HR or marketing infographics
Venngage focuses on professional business infographics — annual reports, HR communications, marketing visuals, and data summaries. Its template library is business-oriented and higher-quality than Piktochart's for formal reports. Charts are functional but not animation-focused. It is a step up from Piktochart when the output is a polished PDF or PNG report rather than a video.
Pricing: Free (watermarked); Premium ~$19/month; Business ~$49/month
Strengths
- Business-focused template library: annual reports, data reports, org charts, HR visuals
- Brand kit and team sharing with role-based access
- Smart diagrams and org chart tools
Limitations
- No animated video export
- Chart types are basic — no advanced chart types like waterfall or treemap
- Free plan exports with watermark and very limited templates
6. Adobe Express
Best for Adobe Creative Cloud users
Adobe Express (formerly Spark) is Adobe's lightweight design tool. Template quality benefits from Adobe's design heritage, and the tool integrates with Creative Cloud assets — fonts, stock images, brand libraries. For teams already in the Adobe ecosystem, Express is the natural lightweight tool for infographics. Animation is preset and not data-driven; chart types are minimal.
Pricing: Free tier; Premium ~$9.99/month standalone, or included in Creative Cloud (~$54.99/month)
Strengths
- Adobe Creative Cloud asset integration — fonts, Adobe Stock, brand kits
- High template quality from Adobe's design library
- AI generative fill and text effects built in
Limitations
- No data-driven chart animation or MP4 chart video export
- Chart types are minimal — basic bar and pie only
- Full feature set requires a Creative Cloud subscription
How to choose
- AECharts — animated data chart videos; bars, lines, and pie charts animate to your data and export as MP4 in seconds; $19/month.
- Canva — general infographic and visual content; largest template library; free tier is generous.
- Visme — data-connected infographics; Google Sheets and CSV import; infographic plus presentation output in one tool.
- Infogram — web-embedded, live-data charts and infographics; charts update when the source data changes.
- Venngage — business reports and HR or marketing infographics; professional business-oriented templates.
- Adobe Express — Adobe Creative Cloud users; seamless CC asset integration and high-quality Adobe templates.